Analysis and Trading with Bill Williams Indicators (Bill Williams Indicators)
Bill M. Williams, a leader in the self-education of investors first began trading in 1959. His background in engineering,physics, psychology and integration of mind and body has created a unique way of looking at the markets. He is considered the forefront of trading theory, and one of the top enthusiasts of how to utilize technical analysis to improve the trading results.Bill Williams thought that the reason of losing in the market lies in traders’ reliance on different types of analyses and on the rules based on them.
Technical Analysis or fundamental analysis?
B. Williams considered them useless and even dangerous, as the market changes all the time and one cannot rely on patterns and theories used in the past. Therefore, he has promoted an approach to trading based on human
psychology rather than strictly using technical or fundamental analysis.According to Williams in order to reach success in the trading field, a trader should know the exact and whole structure of the market.This can be achieved by analyzing the market in five dimensions:
Fractal (phase space)
The driving force (energy phase)
Acceleration (deceleration (power phase)
Zone ( combination of strength / power phase)
Balance Line
Acceleration/Deceleration (AC) Oscillator
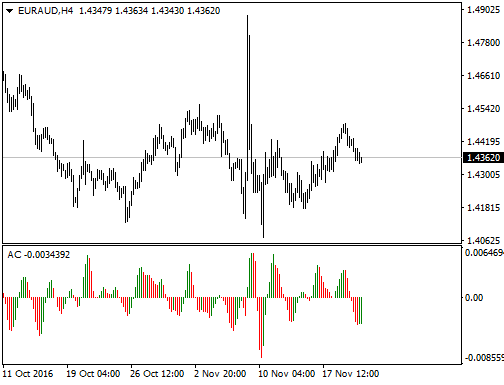
How to Trade and Calculate the Awesome Oscillator
Acceleration/Deceleration (AC) is a technical indicator which displays the acceleration or deceleration of the market driving force at the given moment. The indicator is fluctuating between the median 0.00 (zero) level. Positive values indicate a growing bullish trend, whereas negative values signify bearish trend development. The main feature
of the indicator is that it serves as a warning sign of the possible changes in the trend direction.
So that before any trend reversals take place the indicator changes its direction.It’s important to pay attention both at the value and color of the indicator. Two consecutive green columns above the zero level are signals of entering a market with long position. Conversely, two and more red columns below the zero level indicate the short position.
How to calculate (Acceleration/Deceleration indicator)
The difference between the value of 5/34 of the driving force bar chart and 5-period simple moving average is
equal to the AC bar chart:
AO = SMA(median price, 5)-SMA(median price, 34)
AC = AO-SMA(AO, 5)
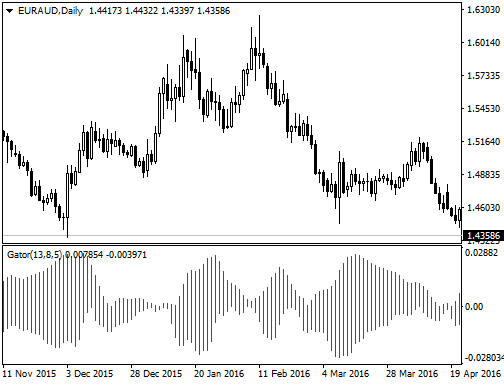
Alligator Indicator (Trading with the Alligator Indicator)
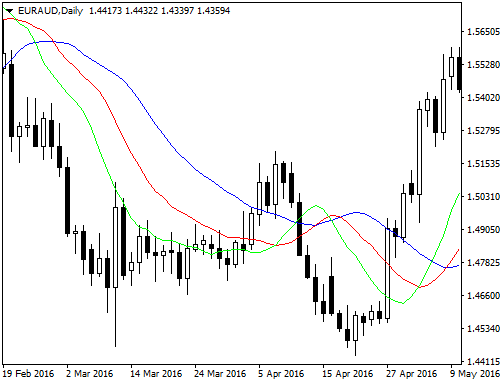
Alligator Indicator Explained – How to Use the Alligator in Forex
Alligator is the indicator which is designed to show a trend absence, its formation and direction.Bill Williams saw metaphorical resemblance between alligator’s behavior and the allegory of the market’s one: sleeping gives way
to price-hunting after which it’s again time to sleep.
The longer the alligator sleeps the hungrier it becomes and logically, the stronger the market movement will be.The indicator includes 13-, 8- and 5-period smoothed moving averages each with its own displacement (8, 5 and 3 bars respectively) which are colored blue, red and green thus representing the alligator’s jaw, teeth and lips.Alligator is sleeping when the three averages are intertwined progressing in a narrow range.
Therefore, more distant averages indicate sooner price movement.If the averages go on in an upward direction (green followed by red and blue) this shows an emerging uptrend interpreted as a signal to buy.On the other hand if the averages follow each other in the reversed order down the slope this indicates a signal of unfolding downtrend. This means that it would be quite appropriate to sell at this point.
How to calculate – Alligator – Bill Williams’ Indicators
MEDIAN PRICE = (HIGH + LOW) / 2
ALLIGATORS JAW = SMMA (MEDEAN PRICE, 13, 8)
ALLIGATORS TEETH = SMMA (MEDEAN PRICE, 8, 5)
ALLIGATORS LIPS = SMMA (MEDEAN PRICE, 5, 3)
Awesome Oscillator (AO) – Awesome Oscillator Strategy
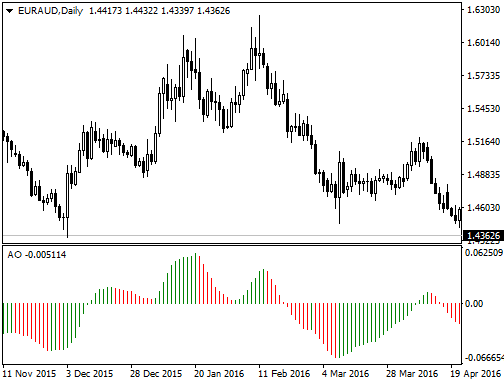
How to Trade and Calculate the Awesome Oscillator
Awesome Oscillator (AO) represents a momentum indicator which reflects precise changes in the market driving force. The main signals presented in the indicator are saucer, nought line crossing and two peaks.Saucer represents three successive columns above the nought line.
The first two columns must be colored red where the second one is lower than the first one. The third column is colored green and stands higher than the second one. The formation like this serves as a signal to buy whereas an inverted formation would be accepted as a signal to sell.
Nought line crossing displays the histogram crossing the nought line in an upward direction which replaces its negative values by that of positive ones. Such a formation serves as a buy signal while its reversed pattern would serve as a sell signal.
Two peaks indicate a buy signal if the figure has the following formation: two consecutive peaks are below the nought line and the later-formed peak stands closer to the zero level than the earlier-formed one. The reverse formation consequently would serve as a sell signal.
How to calculate – Awesome Oscillator (AO)
MEDIAN PRICE = (HIGH+LOW)/2
AO = SMA(MEDIAN PRICE, 5)-SMA(MEDIAN PRICE, 34)
where SMA — Simple Moving Average.
Fractals Indicator – How To Trade The Fractal Indicator
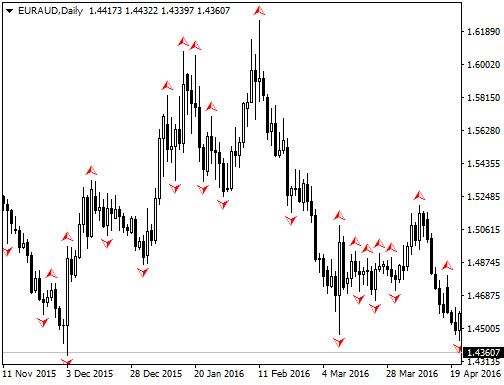
How to Trade and Calculate the Fractals Oscillator
Fractals indicator displays the local heights and lows of the chart highlighting where the price movement has stopped and reversed. These reversal points are called Highs and Lows respectively. Fractals consist of five consecutive bars; the first two bars successively reach higher (or dive deeper), while the last two descend lower (or grow higher). The middle bar hence forms the highest (or the lowest) point in the group.
• The arrow pointing to the top signifies buy fractal
• The arrow pointing to the bottom signifies sell fractal
Gator Oscillator (GO) – Gator Oscillator by Bill Williams
How to Trade and Calculate the Gator Oscillator (GO)
Gator Oscillator (GO) supplements the Alligator indicator and is used together with it.Gator Oscillator has a form of two histograms which are built on either side of the nought line.
In the positive area it reflects the absolute difference between the Alligator’s Jaw and Teeth (blue and red lines) and in the negative area it reflects the absolute difference between the Alligator’s Teeth and Lips (red and green lines).
If the histogram’s bars exceed the previous bar’s volume they are colored green otherwise they are colored red.
Alligator’s activity includes the following four periods:
1. Awaking – the bars on different sides of the nought line are colored differently.
2. Eating – the bars on both sides of the nought line are colored green.
3. Filling out – a single bar appearing during the “eating” phase is colored red.
4. Sleeping – the bars on both sides are red.
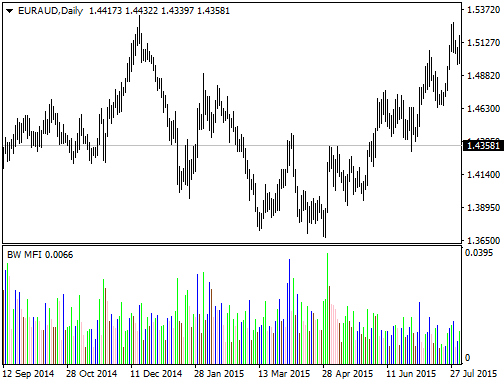
Market Facilitation Index (MFI) Indicator

How to Trade and Calculate the MFI Indicator
Market Facilitation Index indicates the extent of willingness to move the price in the market. The histogram bars show the absolute values of the index; however the comparison of the index and volume dynamics is presented in colors.
• Green bar indicates that both MFI and volume are up. Increasing trading activity signifies acceleration of market movement.
• Blue bar indicates that MFI is up and volume is down. Though the volume has dropped the movement is continuing.
• Pink bar indicates that MFI is down and volume is up. Volume increase in the slowing down movement may
be a sign of possible break.
• Brown bar indicates that both MFI and volume are down. The current direction is not under the market interest
as the latter tries to find signs of future development.
How to calculate – Market Facilitation Index (MFI) | Bill Williams Indicators
BW MFI = (HIGH-LOW)/VOLUME
Source: IFC Markets Broker -Review and Forex Rebates U to 85%
Categories :
Tags : Acceleration/Deceleration (AC) Oscillator Acceleration/Deceleration indicator Alligator - Bill Williams' Indicators Alligator and Fractals of Williams Alligator Indicator Explained Analysis and Trading with Bill Williams Indicators Awesome Oscillator (AO) - Awesome Oscillator Strategy Bill Williams Indicators Gator Oscillator (GO) - Gator Oscillator by Bill Williams Gator Oscillator by Bill Williams How to Trade and Calculate the Awesome Oscillator How to Trade and Calculate the Fractals Oscillator How to Trade and Calculate the Gator Oscillator (GO) How to Trade and Calculate the MFI Indicator How To Trade The Fractal Indicator How to Use the Alligator in Forex Market Facilitation Index (MFI) | Bill Williams Indicators Technical Analysis or fundamental analysis? Trading with the Alligator Indicator

