
[text]
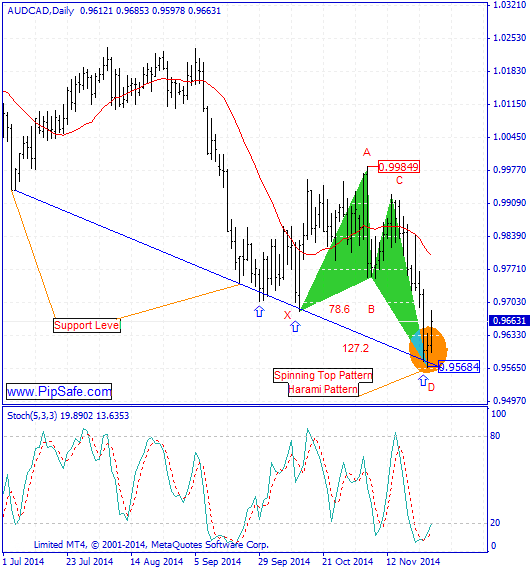
AUD/CAD chart has experienced a strong descending trend during the recent days that could record the bottom price of 0.95684.As it is obvious in the picture below, the price has been stopped from more descending by reaching to the supportive level (made of two bottom prices) and by creating a bottom price(Spinning top and Harami candlestick pattern) in this saturation area starts to ascend which shows the potential for ascending in this currency pair.
As it is obvious in the picture below, between the top price of 0.99849 and the bottom price of 0.95684, there is a butterfly harmonic pattern that with completion of the D point there will be a warning for increasing of the price.Stoch indicator is in saturation sell area and confirms the D point of this pattern by the next cycle and warns about the potential of ascending of the price during the next days.Generally until the price level of 0.95684 is preserved, the price has the potential for ascending and reformation.
AUD/CAD Chart 2014.11.27
Technical Analysis of AUD/CAD Dates 2014.11.27
AUD/CAD Technical Analysis
Written by the technical team of PipSafe Company
[/text]
Categories :
Tags : AUD AUD/CAD butterfly harmonic pattern CAD Forex Harmonic Patterns News Stoch

