
[text]
Technical analysis of AUD/NZD dated 20.02.2015
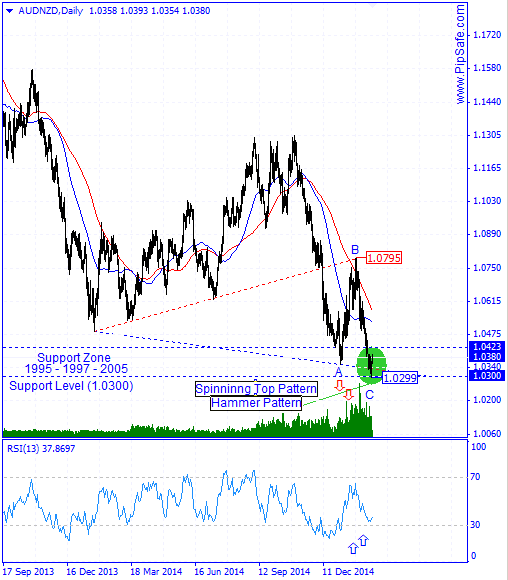
AUD/NZD since 2011 was in a long term and strong downtrend which is currently among the lowest prices. Sellers could achieve the lowest price of 1.0299 during this downtrend.Right now price has been stopped by reaching to the round level of 1.0300 and supportive levels’ range (made of 3 bottom prices dated back to 1995) and by making a bottom price had a little ascend.
formation of hammer candlestick pattern on 19th day in daily time frame, there is a warning for the first failure of sellers in achieving lower prices and formation of a bottom price for increasing of the price in this area.RSI indicator in Daily time frame is in saturation sell area and also in divergence mode with the price chart which confirms the bottom price of 1.0299 and warns about changing price direction.Generally according to the formed signs in price chart until the bottom price of 1.0299 is preserved, price will have the potential for ascending and reformation.
Written by the technical team of PipSafe Company
AUD/NZD Chart
[/text]
Categories :
Tags : ABC AUD/NZD aud/nzd chart Forex Market Analysis Hammer Pattern

