
[text]
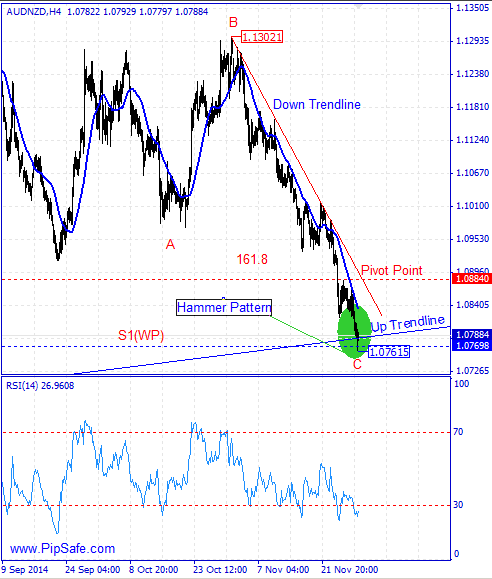
AUD/NZD from the top price of 1.13021 was in a strong descending trend without reformation that could record the bottom price of 1.07615.As it is obvious in the picture below, price during the descending has touched the Up Trendline (made of 3 bottom prices) and also the s1(pw)of 1.07685 and has created the hammer candlestick pattern. Closing of the bullish candle after this pattern will confirm it and warns about ascending of price.According the general ascending trend and not observing a clear technical reason for ascending of price in long term time frames such as monthly and weekly, if the price level of 1.07615 breaks, the price will have the potential of reaching to the support range in this currency pair.
s2(wp)1.06988
s3(wp)1.05781
obvious in the picture below, between the bottom price of 1.07615 and the top price of 1.13021 there is ABC harmonic pattern with the ratio 161.8 that by completing the end point of this pattern, there will be a warning for forming of a bottom price.Generally the first sign for ascending of the price is formation of a bottom price and recording of it in daily time frame.
Technical Analysis of AUD/NZD Dates 2014.12.02
AUD/NZD Technical Analysis
Written by the technical team of PipSafe Company
[/text]
Categories :
Tags : ABC Patern Analysis AUD AUD/NZD Forex Forex cashback NZD

