
[text]
Technical analysis of AUD/USD dated 18.03.2015
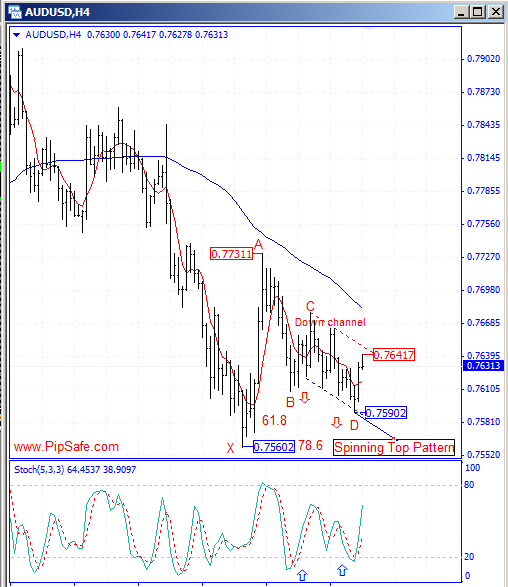
AUD/USD during the recent week was in a strong and consistent Downtrend that Sellers were successful in achieving the lowest price of 0.75602. As it is obvious in the picture below, there is an ideal Gartley harmonic pattern between the top price of 0.77311 and the bottom price of 0.75902 that there is a potential for ceasing of price from D point of this pattern.
Stoch indicator is in saturation Sell area and it is in divergence mode with the price chart that warns the potential for changing price direction. Generally according to the formed sign in the price chart until the bottom price of 1.75602 is preserved, the price has the potential for ascending in this currency pair and the first warning for ascending of price is breaking of the resistance level of 0.76417.
Written by the Technical team of PipSafe
AUD/USD Chart
[/text]
Categories :
Tags : Analysis AUD AUD/USD Forex Analysis Forex Market Analysis Gartley Pattern News Technical analysis usd

