
[text]
AUD/USD Technical Analysis
The AUD/USD posted a higher-high, higher-low on Thursday, but also a lower close. The high came in at .7792. This was well below the last main top at .7818. A trade through this level would’ve turned the main trend to up on the daily swing chart. Sellers probably came in yesterday to defend the trend.
AUD/USD Chart
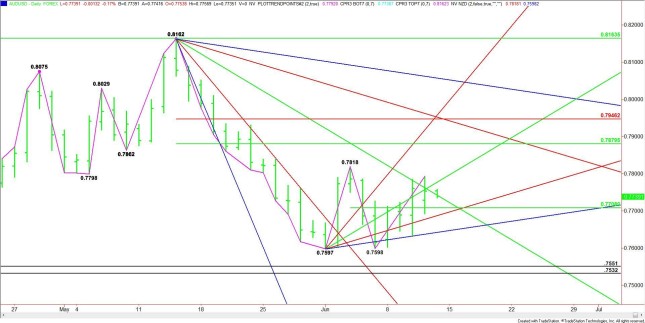
The market also closed on the weak side of an uptrending angle at .7777. This is another sign of increased selling pressure. Today, the key angle to watch is a downtrending angle at .7742. Crossing to the weak side of this angle will be another sign of increased selling pressure.
The short-term range is .7597 to .7818. Its 50% level at .7708 is the first support. This is followed closely by an uptrending angle at .7687. If the trend is getting ready to turn higher then aggressive counter-trend traders are likely to come in on a test of .7708 to .7687.If the angle at .7687 fails as support then look for the selling pressure to extend into the next uptrending angle at .7642. This angle helped provide support earlier in the week. This is an important angle because it is the last potential support before the main bottoms at .7598 and .7597.
The first sign of strength today will be overcoming the uptrending angle at .7777. This move could create enough upside momentum to challenge the main top at .7818. This is also another potential trigger point for an upside breakout.The main range is .8162 to .7597. If buyers take out the main top at .7818 with conviction and turn the main trend to up then the retracement zone formed by the range at .7879 to .7946 becomes the primary upside target.Look for a bullish tone to develop today on a move over .7777 and a bearish tone on a sustained move under .7742.
Source: FXEMPIRE
[/text]
Categories :
Tags : AUD AUD Chart News

