
Crude Oil Technical Analysis – The WTI Crude Oil market initially trying to break above the $50 level, but we turn right back around to form a bit of a shooting star. The shooting star of course is a negative sign, but quite frankly I can see quite a bit of support below at the $48 level. With this being the case, it looks as if there is quite a bit of support at that level, but also all the way down to the $46 handle. With this, I think it’s only a matter of time before buyers come back into this marketplace on signs of supportive action. On the other hand, we could break above the top of the shooting star, and on a daily close above that we would be more than willing to start buying this market as we have been in such a strong uptrend.
Oil Chart
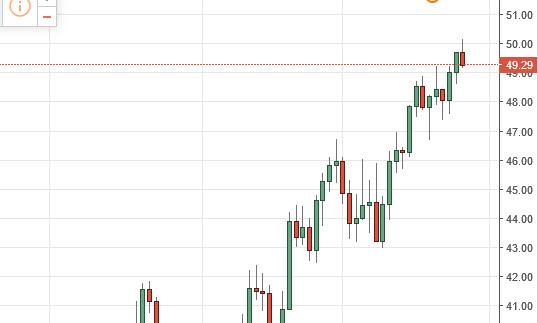
Brent markets of course did very little during the day but it’s obvious that we still have quite a bit of resistance at the $50 level over here as well, so having said that it looks as if the shooting star suggests that were going to pull back to the $48 level, and then possibly the $46 level and even as low as the $44 level. It’s not until we break below the $44 level that we would consider selling this market as we have been in such a nice uptrend lately. Ultimately, we could break above the top of the shooting star, which would be a very positive sign but I see quite a bit of noise and resistance all the way to the $54 level anyway, so with that being the case it is going to be a lot of back and forth type of trading. Yes, I believe that the market should continue to go higher, but it is going to be very choppy and very difficult at times. Pullbacks will continue to offer value, which of course is something that traders will like to take advantage of as well. I have no interest whatsoever in selling.
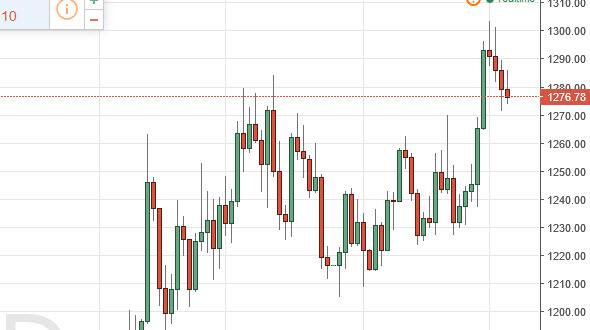
The Gold markets initially tried to rally during the day on Friday, but turned back around to form a little bit of a negative candle. Having said that, the real support is closer to the $1200 level as far as I can see, so at this point in time I have to see whether or not we find some type of supportive candle in order to start going long. On the other hand, if we break above the top of the shooting star from the Thursday session, that would be reason enough to start going long as well, and perhaps reaching towards the $1300 level.
Gold Chart
Source: Fxempire
Categories :
Tags : Crude Oil Technical Analysis

