Daily Forex Market – Gold prices posted a new high yesterday, briefly trading above $1300, last seen in January last year. However, the daily candlestick closed in a doji pattern which could see a near-term downside on a lower close today. EURUSD was also bullish yesterday rallying to last year September highs of 1.15 and could be looking for a test to 1.16.
EURUSD Daily Analysis
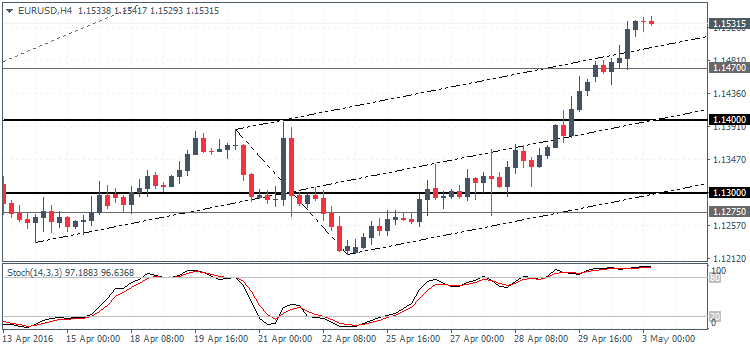
EURUSD (1.15): EURUSD closed above 1.147 breaking above 14th September highs. Price action in EURUSD could now target 24th August highs of 1.16. Failure to break higher could see EURUSD start to consolidate at the current levels, with the potential to dip back to the support at 1.140 level. The bias in EURUSD remains to the upside unless prices break below 1.140 convincingly.
USDJPY Daily Analysis
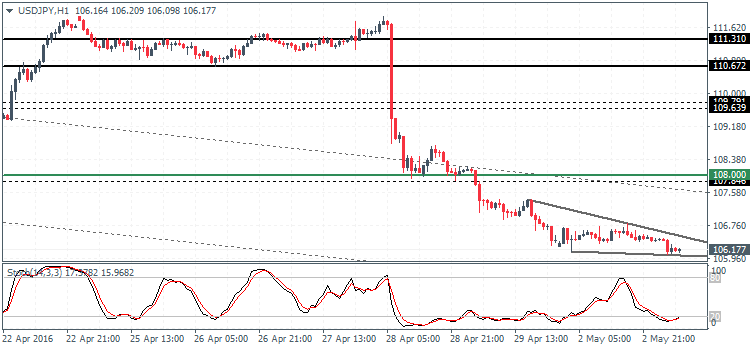
USDJPY (106.1): USDJPY closed in a small bodied candlestick pattern yesterday near the 106 level. Price action is currently flat, but the downside bias could see USDJPY test below 106. Next support level is identified at 105.375. On the 1-hour chart time frame, the price is moving inside a triangle pattern which could signal a potential upside on a breakout for 107.38. A breakout lower could see USDJPY continue to push lower to the next support level.
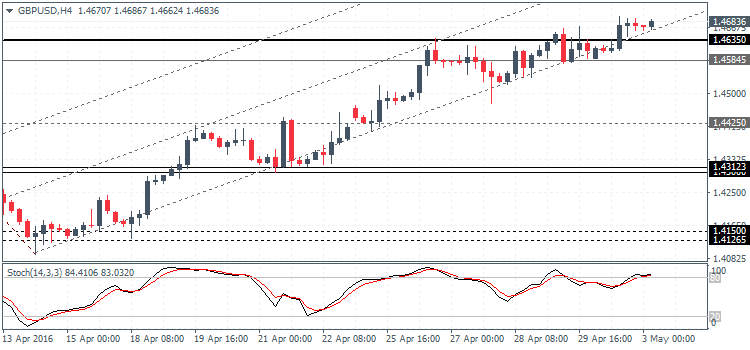
GBPUSD Daily Analysis

GBPUSD (1.46): GBPUSD closed bullish above the previous session’s doji high on the daily chart which could indicate further upside. Price action on the daily time frame is trading in the resistance zone of 1.4743 – 1.4635 which could see limited gains in the near term unless price breaks out above 1.4743 which could then extend the gains. On the 4-hour chart, the bearish divergence continues to play out, but the downside bias is formed only on a break below the current minor support at 1.4635.
Gold Daily Analysis
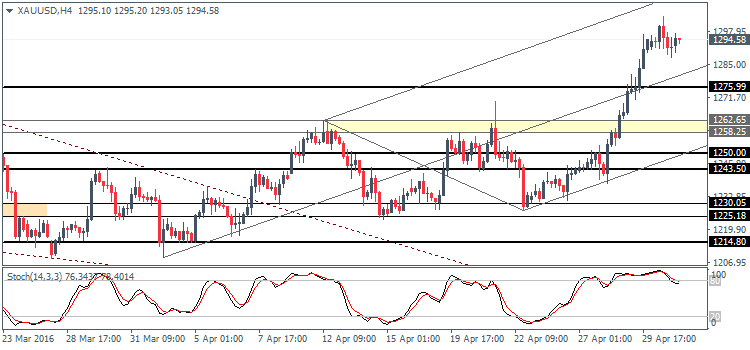
XAUUSD (1294): Gold prices posted a new 52-week high yesterday, but prices closed in a doji pattern, which could indicate a temporary pause in the rally. A daily close below the doji’s low at 1287.73 will, however, confirm near-term weakness in the precious metal, which could see gold drop to 1231.50 level of support. On the 4-hour chart, we notice a price failure to rally to the outer median line which indicates a near-term decline lower. Support levels near 1275 – 1276 will offer an initial support followed by 1262 – 1258 ahead of the stronger support near 1231.50.
Source: Orbex Forex Broker (Review and Forex Rebates Up to 85%)
Categories :
Tags : Daily Forex Market doji pattern EUR/USD forex bonus without deposit Forex Broker forex broker bonus forex learn forex learning forex learning pdf forex tutorials for beginners pdf GBPUSD Daily Analysis how to trade forex for beginners pdf learning forex trading pdf XAUUSD

