
Daily Forex preview – The markets were flat yesterday, but the modest pullback continued with EURUSD attempting to recover the levels near 1.130. The flat price action is likely to continue into today’s session ahead of the US data release which will include durable goods, services PMI and CB consumer confidence numbers being released.
EURUSD Daily Analysis
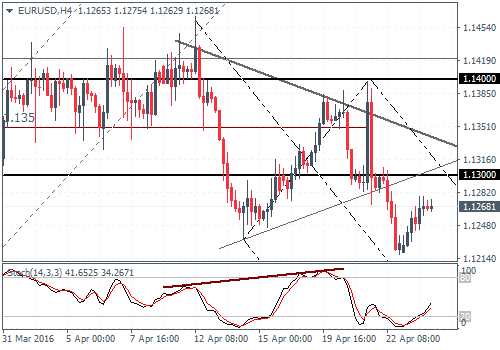
EURUSD (1.12): Closing with a bullish piercing line candlestick pattern on the daily chart, EURUSD is likely to push higher in the near term. With prices trading below 1.130, this level of minor resistance remains the initial level that could cap the upside. A break above 1.130 could send the EURUSD back into the trading range of 1.140 – 1.130. The 4-hour chart shows EURUSD level of 1.13 marking the breakout of prices from the consolidating triangle. The downside remains as long as prices don’t break above 1.135 – 1.137.
USDJPY Daily Analysis
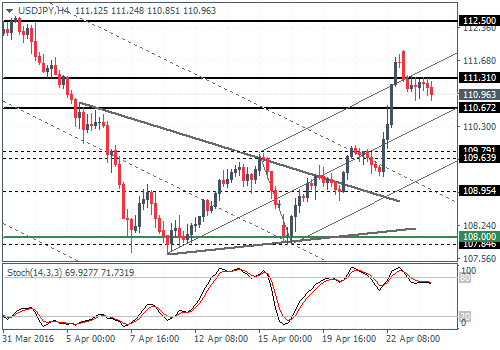
USDJPY (110.9): USDJPY is inching lower with the hidden divergence formed on the daily chart and the recent lower high formed at 111.889 yesterday. Support comes in at 109.8 – 109.5 region which could mark a retest of the upside breakout on the daily chart. USDJPY remains biased to the upside as long as prices remain above the 109 levels, failing which a quick descent towards 108.95 is likely.
GBPUSD Daily Analysis
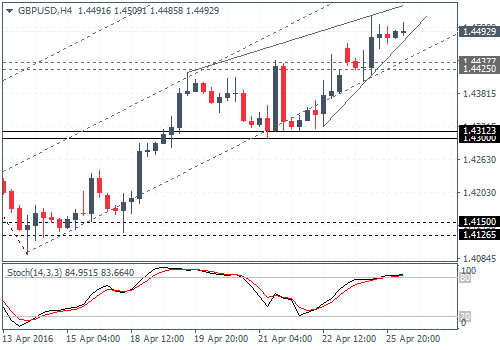
GBPUSD (1.44): GBPUSD remains biased to the upside but yesterday’s price action closing at a spinning top could see some downside unless prices close above previous highs of 1.4519 indicating further continuation to the upside. On the 4-hour chart, the ascending wedge pattern is likely to see prices dip lower. Initial support at 1.443 – 1.4425 is key, and a break below this level could see GBPUSD test the new support at 1.431 – 1.430. As long as GBPUSD holds above this support, there is potential for the upside momentum to continue. A break below the support could, however, see GBPUSD decline lower to test the previous lower support at 1.415 – 1.412.
Gold Daily Analysis
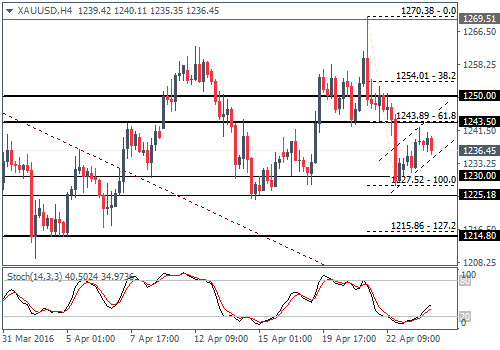
XAUUSD (1236): Gold prices managed to post a modest recovery following Friday’s declines. On the 4-hour chart, Gold is currently consolidating into a bearish flag pattern which could indicate further downside to 1200. However, support at 1230 – 1227.5 needs to be cleared for gold to move lower. In the near term, gold could remain consolidated near 1243 – 1227/1230 levels.
Source: Orbex Forex Broker (Review and Forex Rebates Up to 85%)
Categories :
Tags : forex bonus without deposit Forex Broker forex broker bonus forex learn forex learning forex learning pdf forex tutorials for beginners pdf GBP/USD Gold Gold NEWS how to trade forex for beginners pdf learning forex trading pdf

