
[text]
Daily Technical Analysis 30 July , 2015
Source : AvaTrade Forex Broker (Review and Rebate Program )
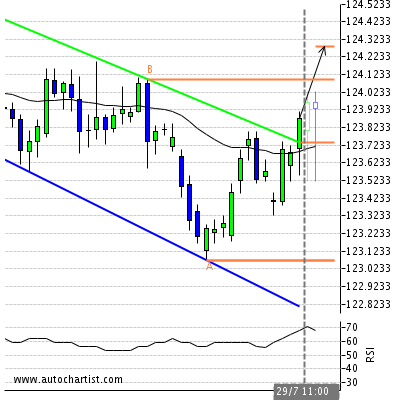
USD/JPY
Summary :
Target Level : 124.2845
Target Period : 3 days
Analysis :
Channel Down has broken through the resistance line at 29-Jul-11:00 2015 GMT-5. Possible bullish price movement forecast for the next 3 days towards 124.284.
Supporting Indicators :
Upward sloping Moving Average
Resistance Levels :
Support Levels
( A ) 123.07Last support turning point of Channel Down.
USD/JPY Chart
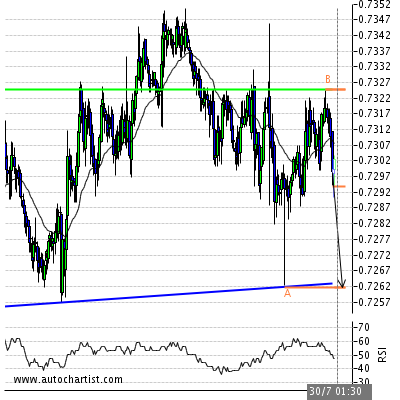
AUD/USD
Summary :
Target Level : 0.7262
Target Period : 21 hours
Analysis :
Head and Shoulders identified at 30-Jul-01:30 2015 GMT-5. This pattern is still in the process of forming. Possible bearish price movement towards the support 0.726 within the next 21 hours.
Supporting Indicators :
Downward sloping Moving Average
Resistance Levels :
( B ) 0.7325Last resistance turning point of Head and Shoulders.
Support Levels
( A ) 0.7262Last support turning point of Head and Shoulders.
AUD/USD Chart
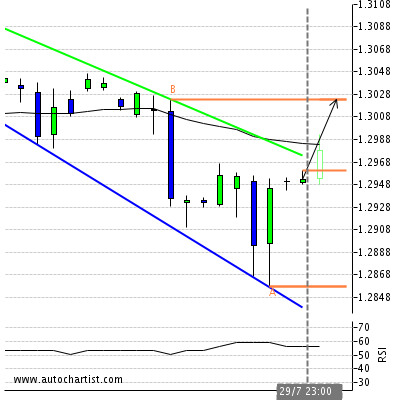
USD/CAD
Summary :
Target Level : 1.3024
Target Period : 2 days
Analysis :
Flag identified at 29-Jul-23:00 2015 GMT-5. This pattern is still in the process of forming. Possible bullish price movement towards the resistance 1.302 within the next 2 days.
Resistance Levels :
( B ) 1.3024Last resistance turning point of Flag.
Support Levels
( A ) 1.2858Last support turning point of Flag.
USD/CAD Chart
[/text]
Categories :
Tags : Daily Forex forex bonus without deposit Forex Broker forex broker bonus forex learn forex learning forex learning pdf forex tutorials for beginners pdf how to trade forex for beginners pdf learning forex trading pdf News USD/JPY usdd/cad

