Source: Orbex Forex Broker (Review and Forex Rebates Up to 85%)
The US dollar is looking slightly bullish attempting to reverse off the recent declines. Gold prices closed in a doji pattern yesterday and a bearish close today could confirm the downside bias while USDJPY might be stepping up for a pullback towards 111.0 resistance. EURUSD remains happy within its ranging pattern. US retail sales will be the key event to watch out for today.
EURUSD Daily Analysis
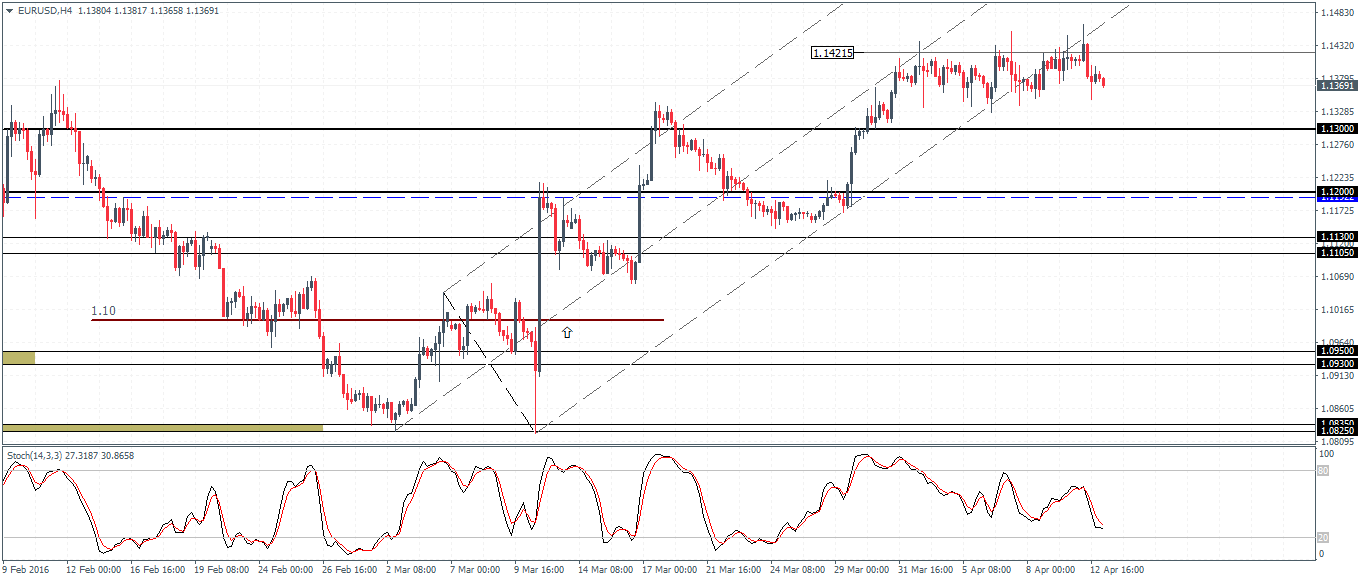
EURUSD (1.13): EURUSD continues with its sideways price action with multiple doji candlesticks being formed near the top end of the rally on the daily chart. Price action is currently pushing lower, but a convincing close lower is needed, preferably below 1.1330 on a daily basis to ascertain the downside move. The lower supports remain unchanged with 1.130 and 1.120 coming in as the initial support levels which could see a minor bounce in prices but with limited upside potential.
USDJPY Daily Analysis
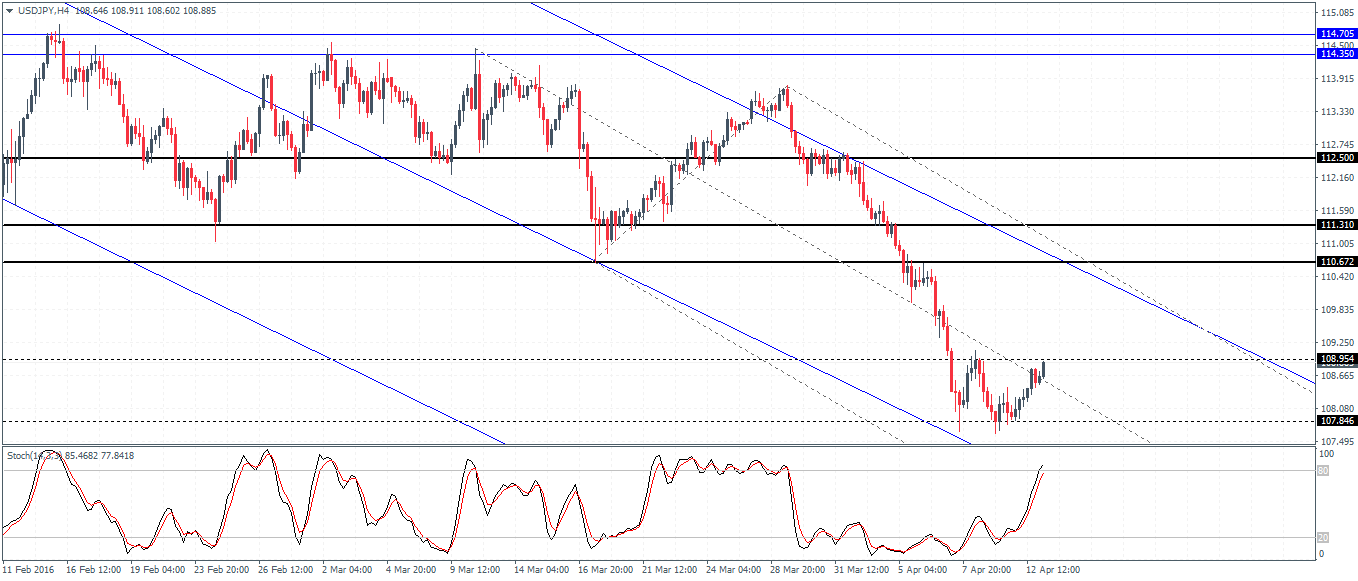
USDJPY (108.8): USDJPY has formed a bottom with prices closing on a bullish engulfing pattern. Any dips are likely to be limited within 108.4 – 108.100 while price action is likely to push towards 111.0 broken support to establish resistance. On the 4-hour chart, with the Stochastics making a higher high against price’s lower high, a modest pullback is likely for a test to 108.10 – 108.15 region. A break above the current resistance at 108.95 will confirm the bullish view for a test to 110.67 and eventually to 111.0.
GBPUSD Daily Analysis
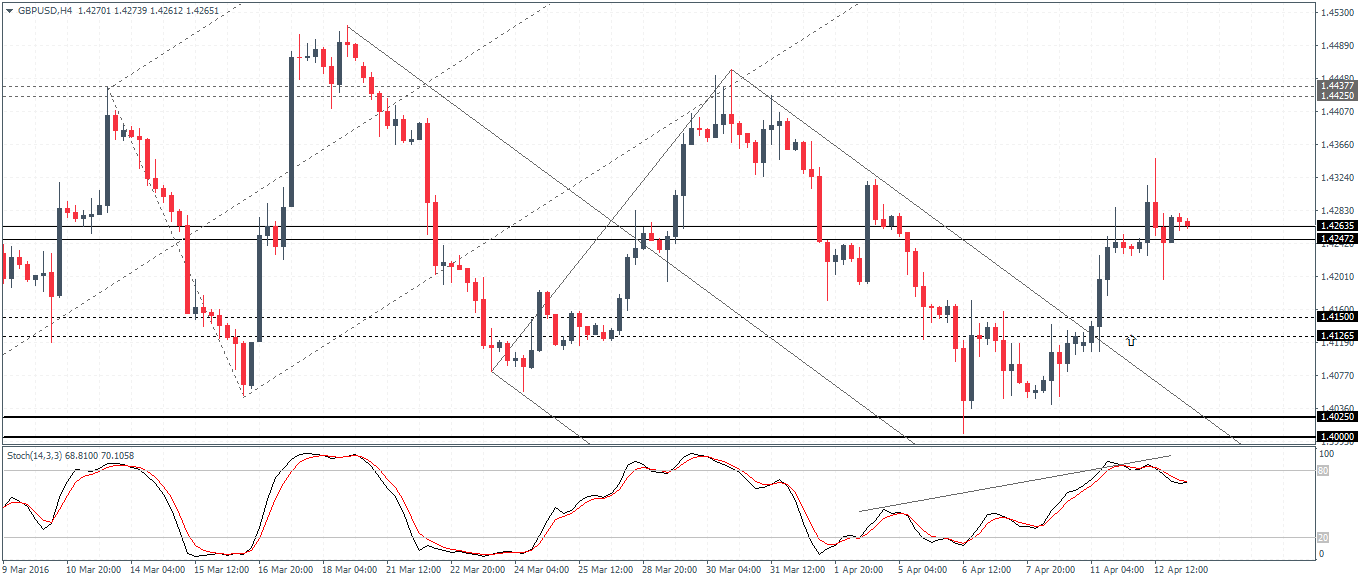
GBPUSD (1.42): GBPUSD is back near the 50 days EMA and could see a potential upside move in the making for a test to 1.4425. The 4-hour chart shows price action trading near the resistance level of 1.42635 – 1.4247 and could indicate a move lower to the support at 1.415 – 1.4126. Establishing support here could see GBPUSD eventually rally towards 1.4425 – 1.4437 region of previously established resistance in the short term. A break below 1.415 – 14126 could, however, spoil the party as GBPUSD could slip towards 1.4025 – 1.40 lower support.
Gold Daily Analysis
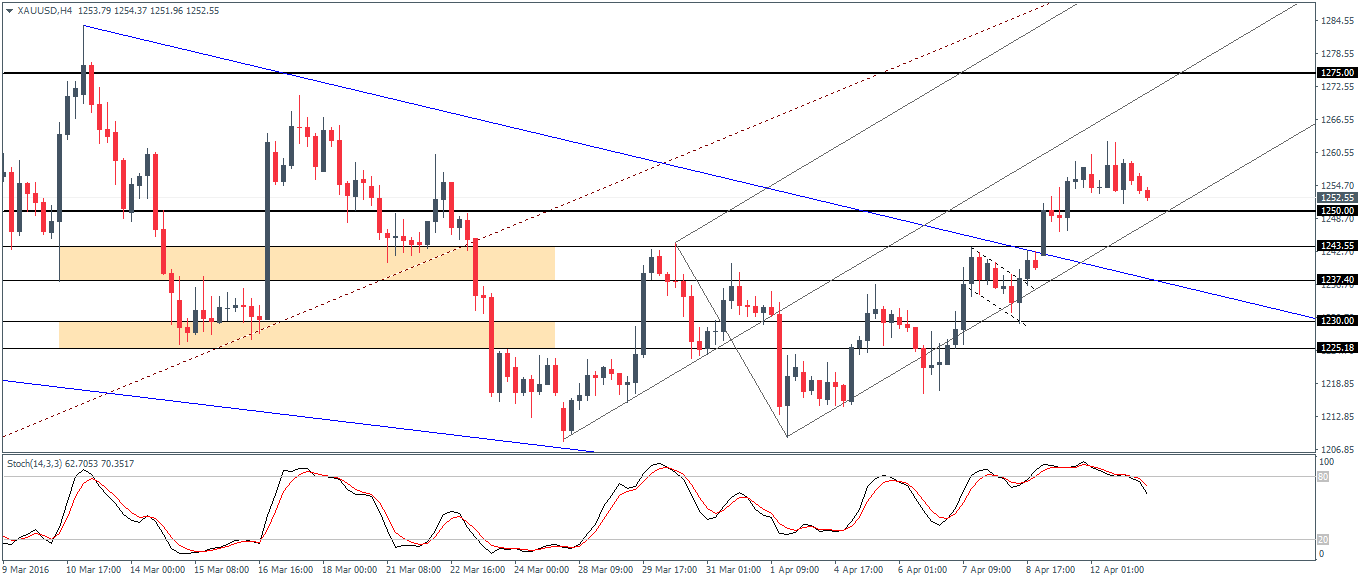
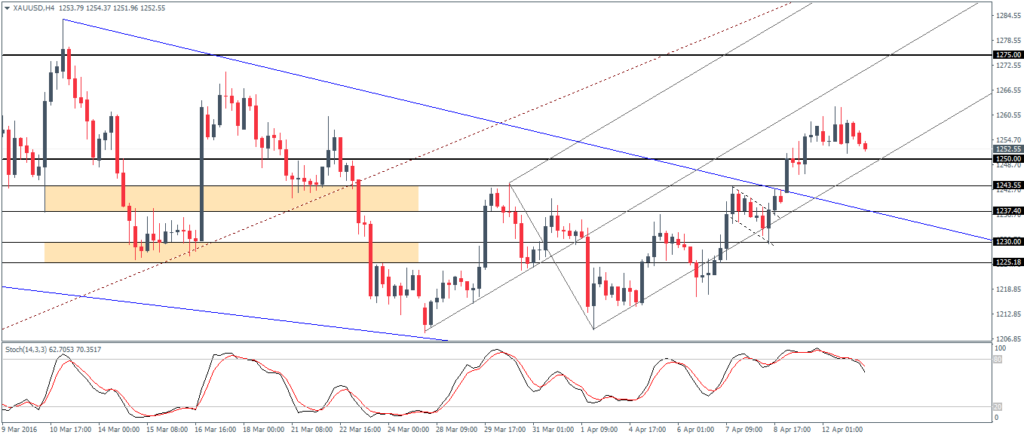
XAUUSD (1252): Gold prices closed in a doji pattern yesterday and indicate potential downside move if we see a daily close below yesterday’s low at 1251.38. The doji pattern comes close to the breakout and retest level from the daily chart’s previously noted ascending wedge pattern. 1231 will be the initial support to the downside; a break below could, however, push Gold towards the 1190 – 1200 levels. With the daily chart pointing to a strong divergence, we can expect further declines towards 1140 levels taking shape over the longer term.
Categories :
Tags : event to watch out for today forex bonus without deposit Forex Broker forex broker bonus forex learn forex learning forex learning pdf forex tutorials for beginners pdf Gold prices closed how to trade forex for beginners pdf learning forex trading pdf ranging pattern US - Retail Sales

