
[text]
Technical Analysis of EUR/GBP dated 2015.01.19
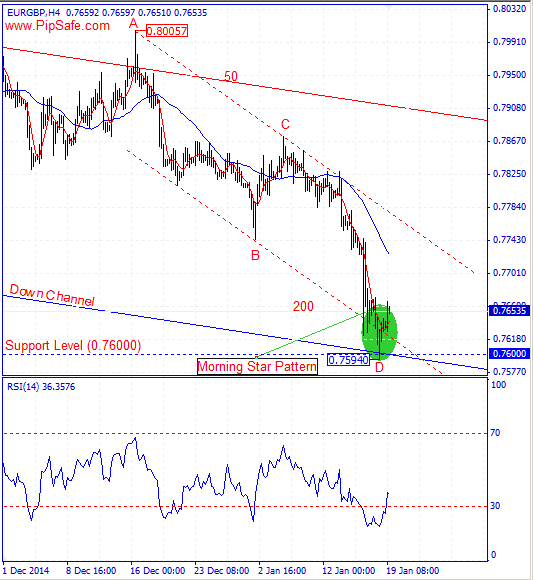
EUR/GBP was in a strong and consistent Downtrend during the recent weeks that Sellers were successful in achieving the lowest price of 0.75940.Right now in daily , weekly and monthly time frames, the price is under 5-day moving average that shows the strong descending trend and warns about more descending.There is a Morning Star candlestick pattern( with 5 starts) in bottom price of 0.75940 that warns the potential for formation of a successful bottom price and Vulnerability of descending trend for sellers. With closing of the next bullish candle, this signal is fixed.
As it is obvious in the picture below, there is AB=CD harmonic pattern with ratios of 50 and 200 between top price of 0.80057 and the bottom price of 0.75940 that warns about changing price direction from the D point of this pattern.RSI indicator in h4 time frame is in saturation sell area and warns about descending of price according to the next cycle during the next candles.Generally according to the technical signs in the price chart until the mentioned supportive levels are preserved, the price has the potential to increase and ascend.
Written by the technical team of PipSafe Company
EUR/GBP Chart
[/text]
Categories :
Tags : AB=CD harmonic pattern EUR/GBP Forex Market Analysis RSI indicator

