
[text]
Technical analysis of EUR/NZD dated 2015.03.24
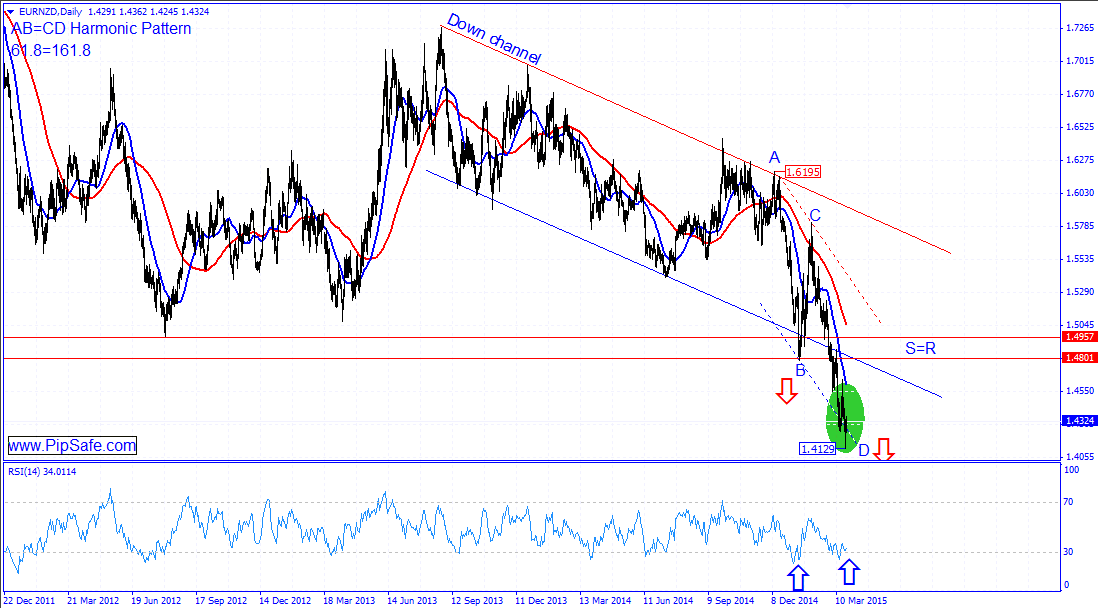
EUR/NZD during the recent week was in a strong downtrend that Sellers were successful in achieving the lowest price of 1.4129 .Right now the price is in the lowest prices in the recorded history and generally in long term interval according to the bottom price of 1.4129 and other factors, it has a good potential for ascending.Currently price at daily time frame has formed Hammer candlestick pattern (To notice this candlestick pattern, there is a need to closure of a descending candle) that shows the first warning signals for the formation of a bottom price.
As it is obvious in the picture below, between the bottom price of 1.4129 and top price of 1.6195, there is an AB=CD harmonic pattern with ideal ratios of 61.8 and 161.8 which warns about ascending of the price from the D point of this pattern.RSI indicator is in saturation sell area and in divergence mode with the price chart confirms the mentioned bottom price and warns about changing price direction.Generally according to the current situation, if the bottom price of 1.4129 records, the price will have the potential in reaching to the S=R .
Written by the Technical team of PipSafe
EUR/NZD Chart
[/text]
Categories :
Tags : AB=CD 61.8 161.8 Analysis eur EUR/NZD EUR/NZD Forecast EUR/NZD News NZD

