[text]
Technical analysis of EUR/USD dated 27.02.2015
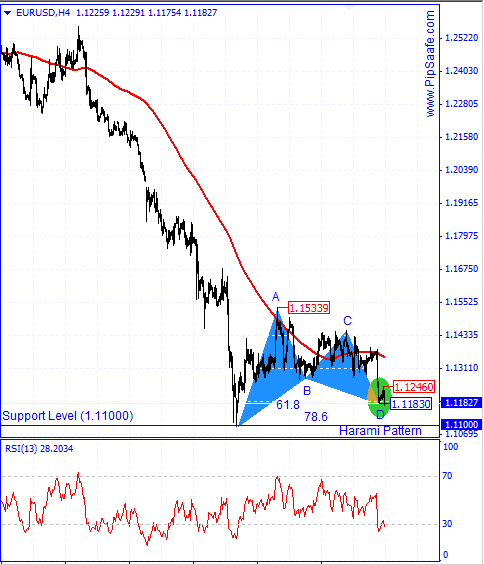
EUR/USD in recent weeks has been in a strong and consistent trend in the price movements which Sellers have been successful in reaching to the lowest price of 1.11830.As it is obvious in the picture below, price during the descending has touched the round supportive level of 1.11000 and has created the hammer candlestick pattern.As it is obvious in the picture below, there is a harmonic Gartley pattern between the bottom price of 1.11830 and the top price of 1.15339 that there is a potential for changing price direction from D point of this pattern.
According to the descending potential in weekly time frame, price reformation of 4H time frame is not stable and by breaking the support level of d point, the ascending signal for 4H time frame will be invalid.RSI indicator in 4H time frame is in saturation sell area of the D point confirms AB=CD harmonic pattern and and with the next cycle warns about ascending of price during the next candles. According to the current selling in the EUR/USD price the first warning for ascending of price is breaking of the resistance level of 1.12460.
Written by the technical team of PipSafe Company
EUR/USD Chart
[/text]
Categories :
Tags : EUR/USD eurusd analysis Forex Technical Analyssis Gartley Pattern


