
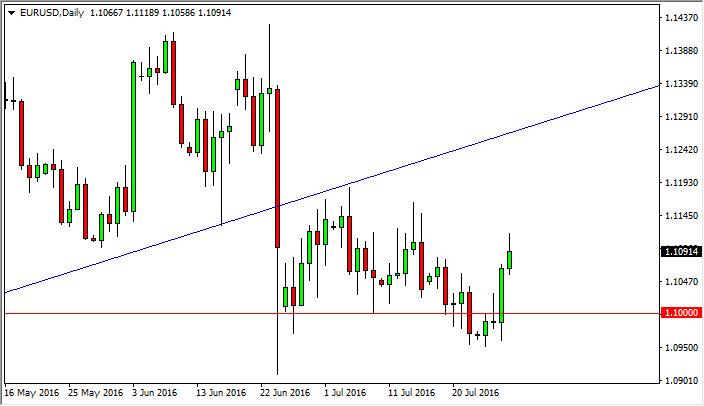
EUR/USD Analysis – The EUR/USD pair rose slightly during the course of the session on Thursday, as we continue to show quite a bit of volatility. However, we are starting to show a bit of resistance just above, so I feel it’s only a matter of time before the market sells off. An exhaustive candle somewhere in this general vicinity or reaching all the way to the 1.12 level would be reason enough for me to start selling again. I have no interest in buying, I believe that the European Union has far too many problems to own the currency.
EUR/USD Chart
The EUR/USD moved higher on the back of a dovish stance from the Fed which is focused on the lack of underlying inflation, and a weaker than expected U.S. jobless claims report. The exchange rate pushed through resistance which is now support near the 200-day moving average at 1.1072. Resistance is seen near the July highs at 1.1186. U.S. initial jobless claims rose 14k to 266k in the week ended July 23 from a revised 252k in the July 16 week.
The latter was the lowest since April 16. This brings the 4-week moving average down to 256.5k from 257.5k.Momentum has turned positive as the MACD (moving average convergence divergence) index generated a buy signal. This occurs as the spread (the 12-day moving average minus the26-day moving average) crossed above the 9-day moving average of the spread. The index moved from negative to positive territory confirming the buy signal. The index is printing in the black with an upward sloping trajectory which points to a higher exchange rate.
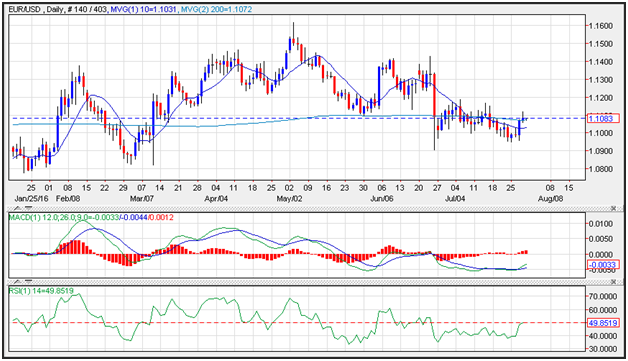
Source: FXEMPIRE
Categories :
Tags : EUR/USD Chart EUR/USD pair MACD

