
[text]
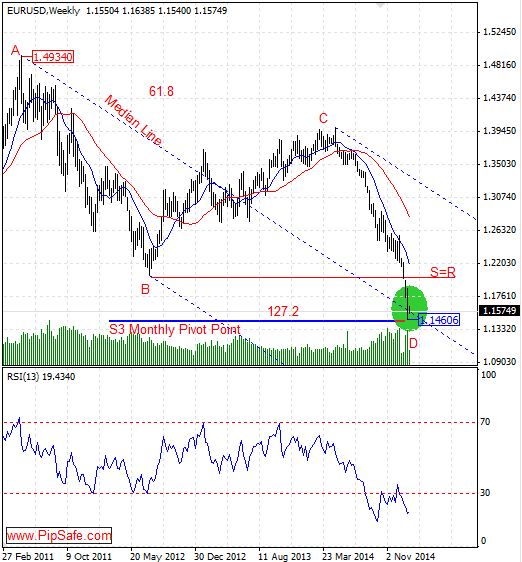
EUR/USD was in a strong and consistent downtrend during the recent weeks that sellers were successful in achieving the lowest price of 1.46406 and According to the recent strong descending , price is in saturation sell area and there is the potential for ascending and price reformation.
Right now price by reaching the Support line of monthly pivot point (S3 MN) and also by creating a Bottom price(Hammer Pattern that need to be confirmed by a bullish candle) in daily time frame has been stopped from more descend.As it is obvious in the picture below, there is AB=CD harmonic pattern between the top price of 1.49340 and the current descend price with ideal ratios of 61.8 and 127.2 that there is a potential for changing price direction from D point of this pattern.
RSI indicator in weekly and daily time frames is in saturation sell area and warns about ascending of price according to the next cycle during the next candles.The first important warning for ascending of the price according to the technical signs is breaking of the resistance level 1.16505.
Written by the technical team of PipSafe Company
EUR/USD Chart
[/text]
Categories :
Tags : AB=CD harmonic pattern EUR/USD Chart Forex Market Analysis monthly pivot point

