
[text]
EUR/USD Technical Analysis (2015.04.13)
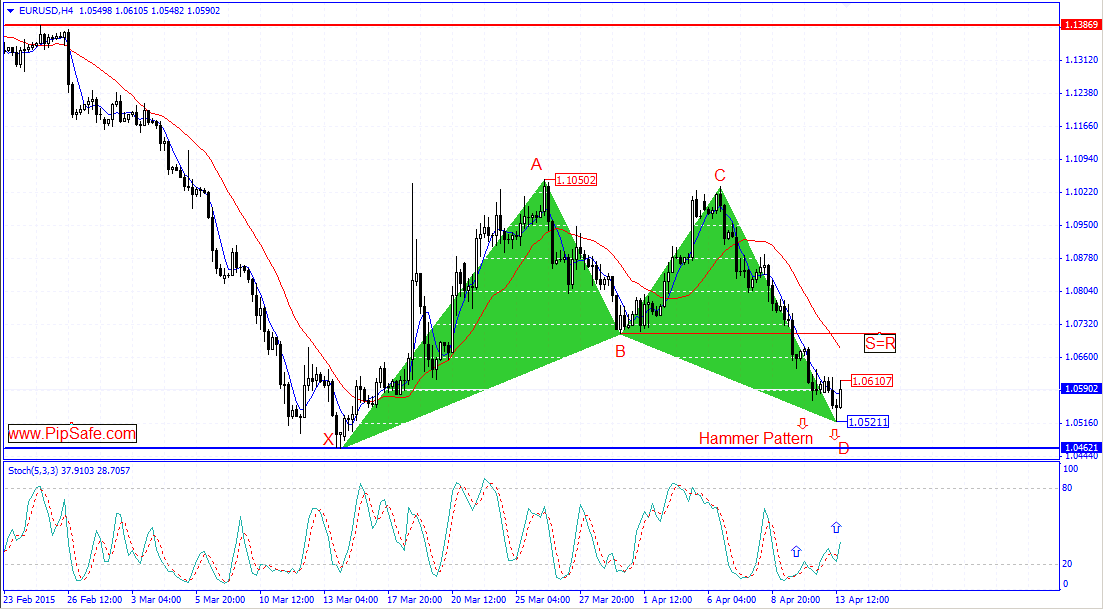
EUR/USD was in a strong and consistent downtrend during the recent days that Sellers were successful in obtaining the lowest price of 1.04621. Currently price in monthly,weekly and daily time frames is under 5-day moving average that shows descending of price during the net candles.As it is obvious in the picture below, there is a Bat Harmonic price pattern between the top price of 1.10502 and the bottom price of 1.05211 that there is a potential for ceasing of price from D point of this pattern.RSI indicator is in saturation sell area and divergence mode with the price chart that confirms the current bottom price and warns about ascending of price during the next candles.
In H4 time frame in the previous candle, the h4 candle appeared as a Hammer candlestick pattern (to notice this candlestick pattern, there is a need to a ascending candle as confirmation) that shows the possibility for formation of a bottom price and ending down the descending of the price).The best sign of ending the descending trend is the formation of the bottom price in daily time frame and fixing of it.
Written by the technical team of PipSafe Company
EUR/USD Chart
 [/text]
Categories :
Tags : Bat Harmonic price pattern EUR/USD Technical Analysis Forex Market Analysis Hammer candlestick pattern Technical analysis

