Everything about Forex Volume Indicators
Volume represents one of the primary indicators of the market transactions and is characterized by the market participants, strength and intensity.It shows the total number of shares/contracts traded within a specified timeframe. The higher volume signifies higher liquidity and higher liquidity is a sign of lower volatility, with
volatility being the size of price moves.
Volume tends to increase in an uptrend direction when the price rises, and, consequently it will decrease when the price falls. In the same way volume increases in a downtrend direction if the prices fall, and decreases as they rise.Here are presented the main features and calculation method of the following volume indicators: Accumulation/Distribution Indicator, Money Flow Index (MFI) Indicator,On-Balance Volume (OBV) Index Indicator and Forex Volumes.
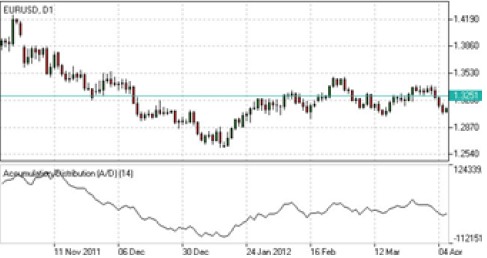
Accumulation/Distribution Indicator (Forex Volume Indicator)
Accumulation/Distribution indicator is designed to identify cumulative inflows and outflows of money for an asset. This is realized by comparing close prices to highs and lows, as well as weighting the relation by trading volumes.
The main purpose of the given indicator is to confirm trend and identify possible turning points.
Trend confirmation:
If A/D line is rising an uptrend in prices is confirmed.
If A/D line is falling a downtrend in prices is confirmed.
Divergence pattern analysis:(How to Trade Divergences)
The downtrend may be weakening to a bullish reversal if the A/D line rises along with decreasing prices.
The uptrend may be weakening to a bearish reversal if the A/D line falls along with rising prices.
How to calculate
A/D(t) = [((C – L) – (H – C)) / (H – L)] x Vol + A/D(t-1),
where:
A/D(t) – current Accumulation/Distribution value;
A/D(t-1) – previous Accumulation/Distribution value;
H – current high;
L – current low;
C – close price;
Vol – volume.
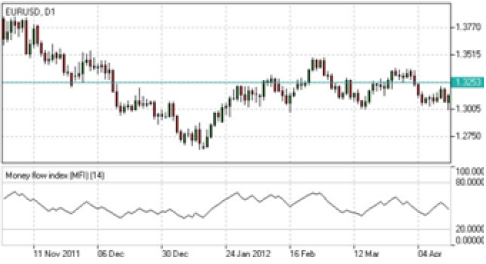
Money Flow Index (MFI) Indicator (How to trade the MFI Indicator)
Money Flow Index (MFI) is an indicator which is designed to estimate the intensity of money inflow in a certain asset. This is done by not only comparing price increases and decreases over a certain period of time, but also taking into account trading volumes.The indicator helps to determine possible turning points and find out whether an asset is overbought or oversold.
Analyzing overbought/ oversold areas:(How to Use the MFI Indicator for Day Trading)
The asset is considered to be overbought if MFI rises above 80. A sell signal arises if MFI crosses the boundary of overbought area from above.
The asset is considered to be oversold if MFI falls below 20. A buy signal arises if MFI crosses the boundary of
oversold area from below.
Analyzing divergence patterns:(Forex divergence patterns)
The downtrend tends to weaken if MFI rises along with decreasing prices.
The uptrend tends to weaken if MFI falls along with rising prices.
How to calculate
In order to calculate the index the following steps should be taken into account:
1. TP = (H + L + C) / 3;
2. MF = TP*Vol;
3. MR = Sum(MF+) / Sum(MF-);
4. MFI = 100 – (100 / (1 + MR)),
where:
TP – typical price;
H – current high;
L – current low;
C – close price;
MF – money flow (positive (MF+) if current TP > previous TP, negative (MF-) otherwise);
Vol – volume;
MR – money ratio.
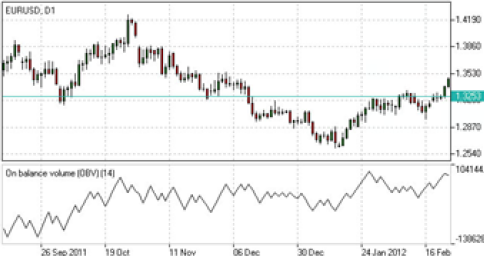
On-Balance Volume (OBV) Index Indicator(OBV Forex Indicator)
On-Balance Volume (OBV) is a technical indicator which is developed to determine the relation between the amount of deals and the movements of asset’s price. The indicator is used to confirm the trend and identify possible turning points.
If the line is rising an uptrend in prices is confirmed.
If the line is falling a downtrend in prices is confirmed.
Analysing divergence pattern: (OBV divergence pattern)
The downtrend may weaken to a bullish reversal if the OBV line rises along with decreasing prices.
The uptrend may weaken to a bearish reversal if the OBV line falls along with rising prices.
How to calculate
OBV(t) = OBV(t-1) + Vol, if C(t) > C(t-1);
OBV(t) = OBV(t-1) – Vol, if C(t) < C(t-1);
OBV(t) = OBV(t-1), if C(t) = C(t-1),
where:
t – current period;
t-1 – previous period;
C – close price;
Vol – volume.
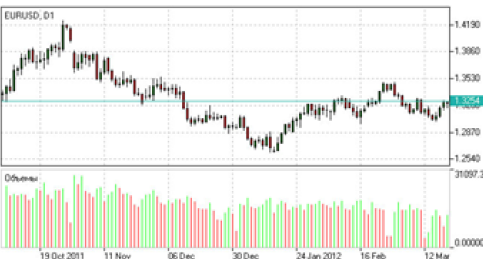
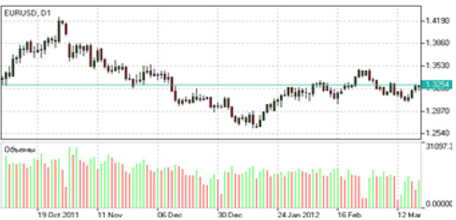
Forex Volumes Indicator
Volume is an instrument of technical analysis which displays trading activity of investors in a certain period of time. Together with price analysis this indicator helps to confirm trend strength and identify further possible reversals.
If the trading volume rises during an uptrend bullish mood is confirmed.
If the trading volume rises during a downtrend bearish mood is confirmed.
A sign of uptrend weakness appears if volumes are falling while price are rising.
How to calculate
Volume = total value/number of transactions during a given period.
Source: IFC Markets Broker
Review and Forex Rebates(Cashback Forex) up to 85% – About IFC Markets
Categories :
Tags : Accumulation/Distribution Indicator Analyzing divergence patterns Divergence pattern analysis Everything about Forex Volume Indicators forex bonus without deposit Forex Broker forex broker bonus Forex divergence patterns forex learn forex learning forex learning pdf forex tutorials for beginners pdf Forex Volume Indicator How to Trade Divergences how to trade forex for beginners pdf How to trade the MFI Indicator How to Use the MFI Indicator for Day Trading Ifc markets broker learning forex trading pdf Money Flow Index indicator OBV divergence pattern OBV Forex Indicator On-Balance Volume (OBV) Index Indicator

