
[text]
Technical analysis of GBP/AUD dated 06.03.2015
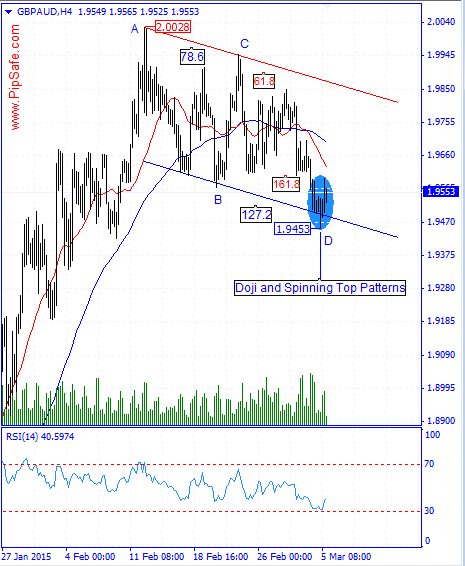
As it was mentioned in the previous analysis of this currency pair dated 16.02.2015, according to the formed signs in this price chart, there was the possibility of descending of price which finally happened.As it is obvious in the picture below, price with reaching to the supportive edge of Down channel has been stopped from more descend and by forming a bottom price (Doji Pattern) of 1.9453 has prepared the field for ascending of price.
AS it is obvious in the picture below, there is an ideal AB=CD harmonic pattern between the top price of 2.0028 and the bottom price of 1.9453 with ratios of 78.6 and 127.2 that warns the ascending of price from the D point.RSI indicator is in saturation sell area that confirms the current harmonic pattern with the next cycle but because of non-compliance and coordination with larger time frames, this signal is not much valid.Based on current chart , there is a probability for bullish candles , First notice for starting bearish trend will be came out after punching D spot in 1.9453 level.
Written by the technical team of PipSafe Company
GBP/AUD Chart
[/text]
Categories :
Tags : AB=CD AB=CD harmonic pattern forex bonus without deposit Forex Broker forex broker bonus forex learn forex learning forex learning pdf Forex News forex tutorials for beginners pdf GBP/AUD GBP/AUD Chart how to trade forex for beginners pdf Latest Forex News learning forex trading pdf News

