
Forex Market Report
Analysis for AUDCAD
A double top formation was completed, as it can be seen on the chart, which is a strong reversal signal. Since the price broke and closed below both MA, it is likely that the trend will push further downwards. A short position could be opened at the current price point.
Indicators Used
20 period MA on a daily chart
40 period MA on a daily chart
Stochastic Oscillator (5,3,3)
Resistance Levels
0.99339, 1.02424
Support Levels
0.97053, 0.95877, 0.95537

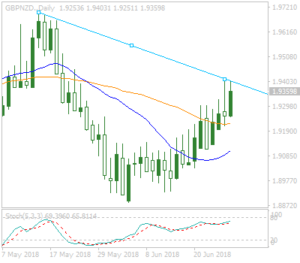
Analysis for GBPNZD
The pair made a strong upwards push and the price broke over both MAs but failed to break over the drawn trend line. Furthermore, the 20 period MA is moving towards crossing over the 40 period MA which will provide a bullish signal. Currently it appears that the price will move downwards making a correction after the said upwards push. A short position could be opened at the current price point.
Indicators Used
20 period MA on a daily chart
40 period MA on a daily chart
Stochastic Oscillator (5,3,3)
Resistance Levels
1.94142, 1.96992
Support Levels
1.89281, 1.88839
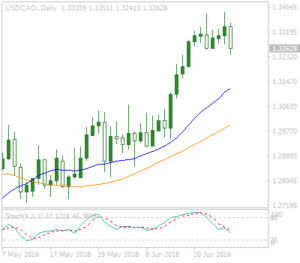
Analysis for USDCAD
The bullish trend of the pair shows no signs of reversing. The price pushed high over both MA’s and it is now likely that a correction will happen before the uptrend continues. A long position could be opened after the said correction happens in order to obtain a better entry point.
Indicators Used
20 period MA on a daily chart
40 period MA on a daily chart
Stochastic Oscillator (5,3,3)
Resistance Levels
1.33858
Support Levels
1.29494, 1.28571, 1.28182
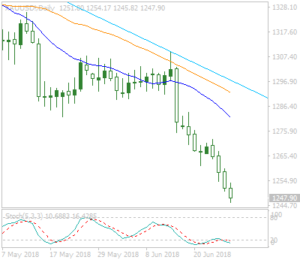
Analysis for Gold
The price made a steep downwards movement and crossed below both MAs continuing its bearish momentum. Due to the steepness of the movement and the fact that the stochastic oscillator made a bullish cross in the oversold area, it is likely the price will push upwards. A long position could be opened assuming that the next day’s candle does not make a new low.
Indicators Used
20 period MA on a daily chart
40 period MA on a daily chart
Stochastic Oscillator (5,3,3)
Resistance Levels
1272.39, 1309.15, 1325.81
Support Levels
1236.31
Categories :
Tags : Forex Market Report

