
[text]
Technical analysis of GBP/SGD dated 15.04.2015
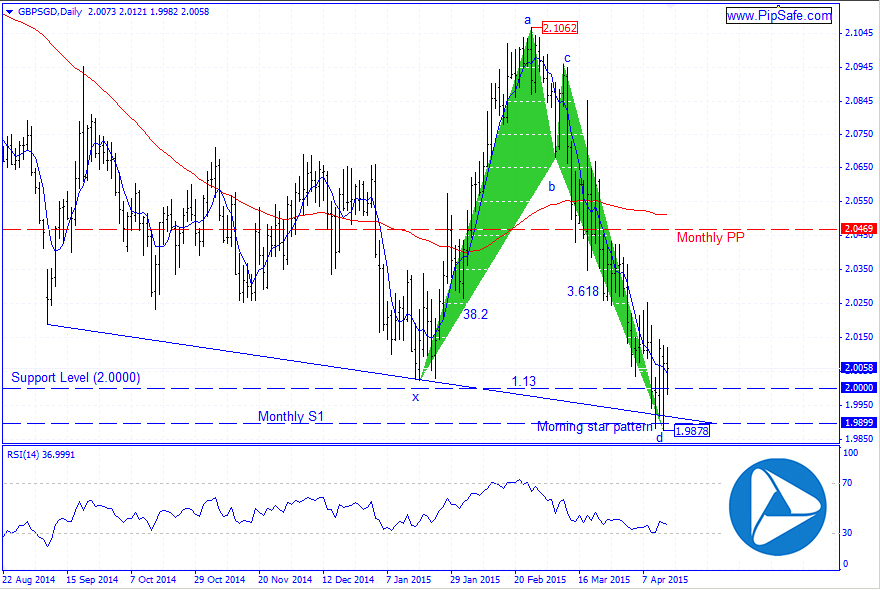
GBP/SGD during the recent week was in a strong and consistent downtrend that sellers were successful in achieving the lowest price of 1.9878. Right now price in long time frames such as monthly and weekly is under 5-day moving average and warns about price decrease in long period of time.As it is obvious in the picture below, price during the descending has touched the support line (made of 2 bottom prices) and also the round supportive level of 2.0000 and has created the hammer pattern.
Closing of the bullish candle after this pattern will confirm it and warns about ascending of price.According to the formed movements in the price chart, between the bottom price of 1.9878 and the top price of 2.1062 there is an ideal alt Bat harmonic pattern that by completion of the D point, there will be the possibility for changing price direction in this currency pair.The first warning for sellers is breaking of the resistance level of 1.0128 (the highest level on the previous day).
Written by the technical team of PipSafe
GBP/SGD Chart
[/text]
Categories :
Tags : alt bat pattern Bat harmonic pattern Forex Analysis forex bonus without deposit Forex Broker forex broker bonus forex learn forex learning forex learning pdf Forex Technical Analysis forex tutorials for beginners pdf GBP/SGD Chart how to trade forex for beginners pdf learning forex trading pdf

