
Forex Trend Continuation Patterns
Chart patterns are geometric shapes which can help a trader not only understand the price action, but also make predictions about the price possible movement.Trend continuation patterns are figures of the same type which are formed as a result of price consolidation during its movements. They are formed at shorter time intervals during the pause in the current market trends and mainly mark the movement continuation.
They suggest that the market will maintain an established trend. Continuation patterns help traders to differentiate between a price action that is in full reversal and those just taking a pause. Most traders believe that there is a time to trade and a time to rest as the formation of continuation candlestick patterns imply consolidation, i.e. a time to rest and watch.These patterns indicate that the price action displayed is a pause in the prevailing trend and that upon breaking out of the pattern the price trend will continue in the same direction.The most popular figures included in the continuation patterns and consequently presented below are Ascending Triangle, Descending Triangle, Symmetric Triangle, Bullish Rectangle, Bearish Rectangle,Flag, Pennant, Wedge.
Ascending Triangle price pattern (Forex Ascending Triangle Pattern)
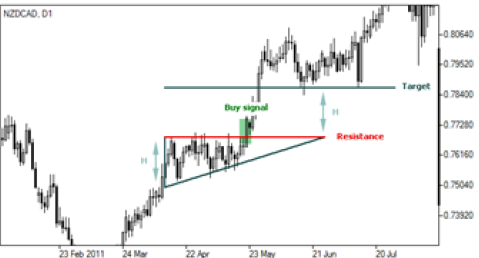
Ascending triangle represents a trend continuation pattern which is formed in an uptrend serving as a confirmation of existing direction.It displays a narrowing range between high and low prices which visually form a triangle.The ascending triangle is characterized by a horizontal trendline called resistance and an ascending trendline called support. The former connects the price highs arranged at the same level and the latter connects price higher and
higher lows.Price break above the resistance line usually somewhere between halfway and ¾ length of the pattern indicates a signal to buy.
How to calculate Ascending Triangle pattern?
T = R + H,
Where:
T – target price;
R – resistance (horizontal line);
H – pattern’s height (distance between support and resistance lines at pattern’s origin).
Descending Triangle Price Pattern ( Forex Descending Triangle Pattern )
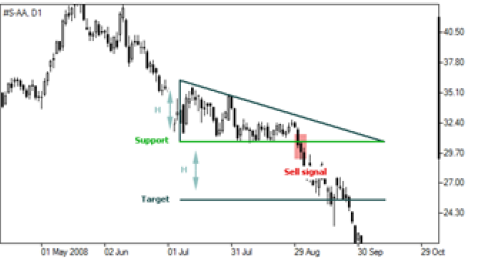
Descending triangle represents a trend continuation pattern which is formed in a downtrend serving as a confirmation of existing direction. It displays a narrowing range between high and low prices which visually form a triangle. The descending triangle is characterized by a descending trendline called resistance and a horizontal trendline called support. The first one connects lower and lower highs and the second one connects price lows arranged at almost the same level.Price break below the support line usually somewhere between halfway and ¾ length of the pattern indicates a signal to buy.
How to calculate Descending Triangle Pattern?
T = S – H,
Where:
T – target price;
S – support (horizontal line);
H – pattern’s height (distance between support and resistance lines at pattern’s origin).
Symmetric Triangle Price Pattern ( Forex Symmetric Triangle Pattern )
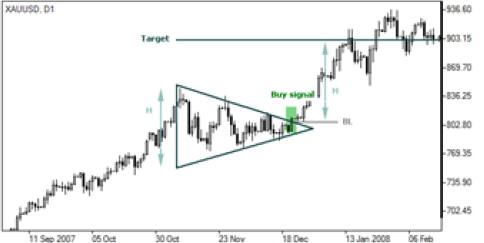
Symmetric triangle represents a trend continuation pattern which can similarly be formed both in an uptrend and a downtrend. Trend direction is confirmed when appearing on the chart.The main feature of symmetric triangle is that
the latter displays a narrowing range between high and low prices thus visually forming a triangle.It is formed of a descending trendline,called resistance, and an ascending trendline,called support. The former connects lower and
lower highs and the latter connects higher and higher lows of price. Price break is a crucial factor in confirming
the direction of trend movement:
If the triangle is formed in a downtrend the price break below the support line will indicate a signal to sell.
If the triangle is formed in an uptrend the price break above the resistance line will indicate a signal to buy.
How to calculate Symmetric Triangle Pattern?
In case of an uptrend:
T = BL + H
In case of a downtrend:
T = BL – H
Where:
T – target price;
BL – breakthrough level (point where the price leaves the triangle);
H – pattern’s height (distance between support and resistance lines at pattern’s origin).
Bullish Rectangle Price Pattern ( Forex Bullish Rectangle Pattern )
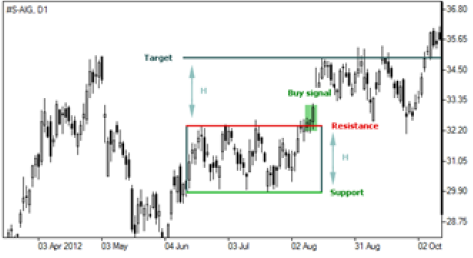
Bullish rectangle pattern is a trend continuation pattern which is usually formed in an uptrend and signals the trend’s direction. It is characterized by support and resistance levels which connect recent highs and lows of the price.If the price rises above the resistance line a buy signal appears.
How to calculate Bullish Rectangle Pattern?
T = R + H,
Where:
T – target price;
R – resistance level (pattern’s top);
H – pattern’s height (distance between support and resistance).
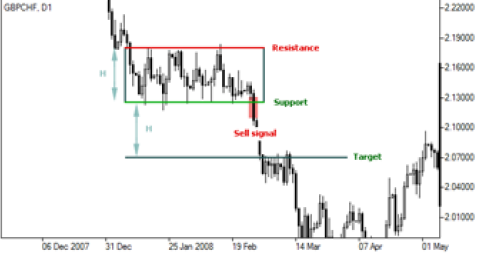
Bearish Rectangle Price Pattern ( Forex Bearish Rectangle Pattern )
Bearish rectangle pattern is a trend continuation pattern which is usually formed in a downtrend and signals the trend’s direction. It is characterized by support and resistance levels which connect recent lows and highs of the
price. If the price falls below the support line a sell signal appears.
How to calculate Bearish Rectangle Pattern ?
T = S – H,
Where:
T – target price;
S – support level (pattern’s low);
H – pattern’s height (distance between support and resistance).
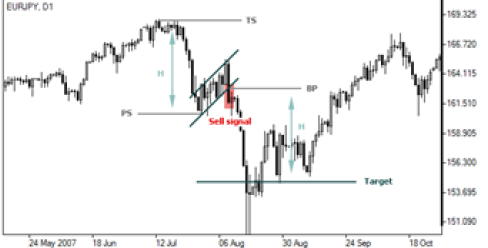
Forex Flag Price Pattern (Forex Flag Price Pattern)
Flag is a minor and short-term trend continuation pattern indicating the previous direction which will prevail after its formation.Flag is formed within a week. It comprises two trendlines: support and resistance levels, which
represent the range between high and low prices,visually forming a parallelogram or a flag.The formation of the given pattern implies that the price may change at the same direction as it was going prior to the pattern. This pattern determines the direction of trend movement by price breaking:
• If in a downtrend the price falls below the support line a sell signal arises.
• If in an uptrend the price rises above the resistance line a buy signal arises.
How to calculate Flag Price Pattern?
In case of a downtrend:
T = BP – (TS – PS)
In case of an uptrend:
T = BP + (PS – TS)
Where:
T – target price;
BP – breakthrough point;
TS – trend start point;
PS – pattern start point.
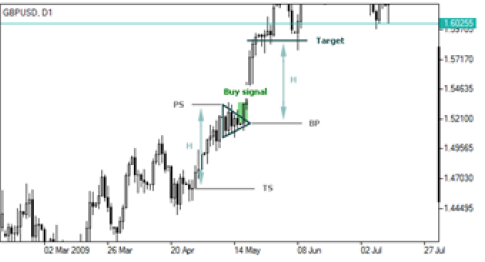
Pennant Price Pattern (Forex Pennant Pattern)
Pennant is a minor and short-term trend continuation pattern indicating the previous direction which will prevail after its formation.Pennant is formed within a week. It comprises two converging trendlines: support (upward
sloping) and resistance (downward sloping)which visually form a triangle. The formation of the given pattern implies that the price may change at the same direction as it was going prior to the pattern.This pattern determines the direction of trend movement by price breaking:
• If in a downtrend the price falls below the support line a sell signal arises.
• If in an uptrend the price rises above the resistance line a buy signal arises.
How to calculate Pennant Pattern?
In case of a downtrend:
T = BP – (TS – PS)
In case of an uptrend:
T = BP + (PS – TS)
Where:
T – target price;
BP – breakthrough point;
TS – trend start point;
PS – pattern start point.
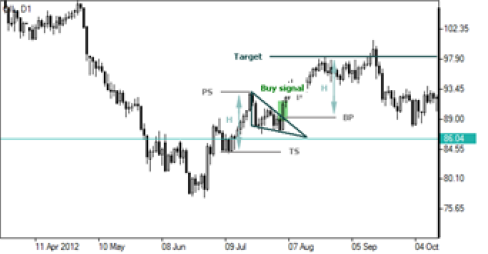
Wedge Price Pattern (Forex Wedge Pattern)
Wedge is a minor and short-term trend continuation pattern indicating the previous direction which will prevail after its formation. Wedge is formed within a week. It comprises two trendlines: support and resistance levels which visually form a triangle. Both of the trendlines can be either downward sloping (in an uptrend) or upward sloping (in a downtrend)against the direction of the primary trend. The formation of the given pattern implies that the price may change at the same direction as it was going prior to the pattern. This pattern determines the direction of trend movement by price breaking:
• If in a downtrend the price falls below the support line a sell signal arises.
• If in an uptrend the price rises above the resistance line a buy signal arises.
How to calculate Wedge Price Pattern?
In case of a downtrend:
T = BP – (TS – PS)
In case of an uptrend:
T = BP + (PS – TS)
Where:
T – target price;
BP – breakthrough point;
TS – trend start point;
PS – pattern start point.
Source: IFC Markets Broker
Categories :
Tags : Ascending Triangle price pattern Bearish Rectangle Price Pattern Bullish Rectangle Price Pattern Descending Triangle Price Pattern Forex Ascending Triangle Pattern forex bonus without deposit Forex Broker forex broker bonus Forex Bullish Rectangle Pattern Forex Descending Triangle Pattern Forex Flag Price Pattern Forex Pennant Pattern Forex Symmetric Triangle Pattern Forex Trend Continuation Patterns How to calculate Ascending Triangle pattern? How to calculate Bearish Rectangle Pattern ? How to calculate Bullish Rectangle Pattern? How to calculate Descending Triangle Pattern? How to calculate Flag Price Pattern? How to calculate Pennant Pattern How to calculate Symmetric Triangle Pattern? How to calculate Wedge Price Pattern? Pennant Price Pattern Symmetric Triangle Pattern Symmetric Triangle Price Pattern

