
[text]
Technical Analysis of GBP/USD Dates 2014.12.24
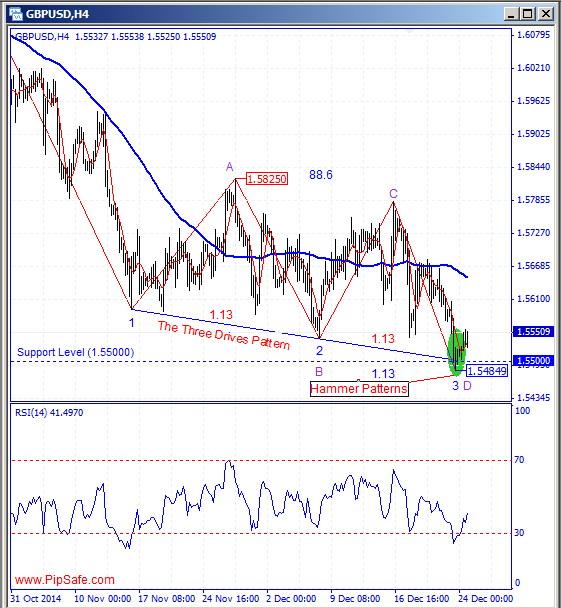
GBP/USD had an descending trend without a noticeable reformation during the recent weeks that shows Sellers certainty in reaching to the predetermined targets.The price could record the Bottom price of 1.54849 in 4H time frame which is fixed by ascending candle(Hammer Patterns).As it is obvious in the picture below, price during the descending has touched the Support Level (made of 2 bottom prices) and also the round supportive level of 1.55000 and has created the hammer candlestick patterns.
According to the formed movements in the chart, there is AB=CD harmonic pattern (Also the The Three Drives Pattern) with ideal ratios of 88.6 and 1.13 between top price of 1.58250 and the bottom price of 1.54849 that warns about changing price direction from the D point of this pattern.RSI indicator is in saturation Sell area and confirms the D point of this pattern by the next cycle and warns about the potential of ascending of the price during the next days.One of the important warnings for ascending of the price is formation of the candlestick pattern in daily time frame or closing of a ascending candle which prepares the field for ascending of the price.
Written by the technical team of PipSafe Company
GBP/USD Chart dated 2014.12.24
[/text]
Categories :
Tags : AB=CD harmonic pattern GBP GBP/USD GBP/USD Analysis GBP/USD News The Three Drives Pattern

