
[text]
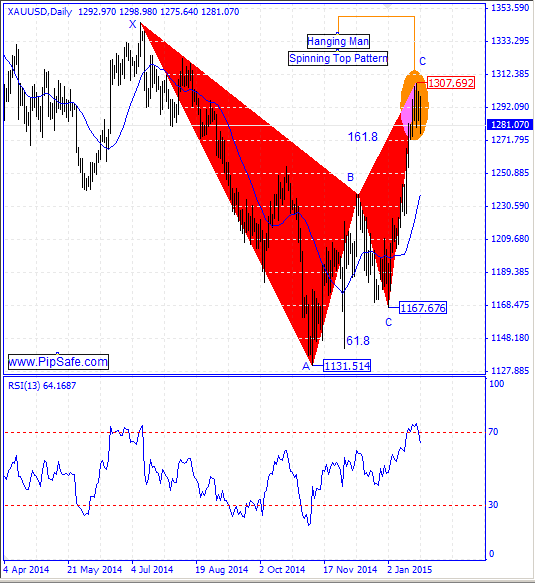
As it was mentioned in the previous technical analysis of Gold dated 2014.12.29, according to the formed technical signs, there was the potential for ascending of price which finally happened. Buyers were successful in achieving the highest price of 1307.692.Price has been stopped from more ascending with reaching to the Resistance round level of 1300.00(Buyers use this lever to exit their trades) and starts to descend.In daily time frame on 21th day a candle with small body(Spinning Top Pattern) formed which showed the indecision market in ascending or descending of the price and it is a weak warning for stopping of the market.
As it is obvious in the picture below, there is non-ideal Gartley harmonic pattern between the top price of 1307.692 and the bottom price of 1131.514 that there is a potential for ceasing of price from D point of this pattern.RSI indicator in Daily time frame is in saturation buy area and with the next cycle warns about descending of price during the next candles, but because of lack of coordination with the weekly and monthly time frames is not much valid.Currently the first sign for buyers is breaking of the D point of harmonic pattern in the price chart.
Written by the technical team of PipSafe Company
Gold Chart
[/text]
Categories :
Tags : Gartley Harmonic Pattern Gold Gold NEWS RSI indicator

