
[text]
Gold Technical Analysis (2015.09.02)
Gold markets initially rallied during the course of the day on Tuesday, but ran into far too much trouble near the $1150 level to continue going higher. Ultimately, we believe that the shooting star that form for the session suggests that the downward pressure is going to continue. We are in a longer-term downtrend, and even though we have seen a massive surge higher, we are still far below significant amounts of resistance. With this, we are much more interested in selling than buying, and recognize that a break down below the bottom of the shooting star could be the opportunity.
Also, you have to keep in mind that the US Dollar Index formed a hammer, and it appears that dollar strength will work against the value of gold and other precious metals in the futures markets. We believe that there is a significant amount of support at the $1115 region though, so we know that any selling opportunity will probably be short-lived. On the other hand though, we know that a break above the top of the shooting star would be very bullish, but there’s also massive amounts of resistance near the $1160 handle. In other words, no matter what happens it is going to be a short-term move but we prefer to go with the overall trend when it comes to trading gold as it has been so bearish for so long.
Ultimately, we would need to see some type of longer-term buying opportunity get truly excited about going long, and we will look to the weekly chart for those types of signals. In the meantime, we have to assume that the selling pressure is still strong, and as a result we prefer to sell and not buying. Keep in mind that the US dollar will heavily influence what happens in this market, so keep an eye on the US Dollar Index as well. If that fails to strengthen, that could be an opportunity to serve buying gold, but at this point in time we are not willing to take that risk.
Gold Chart
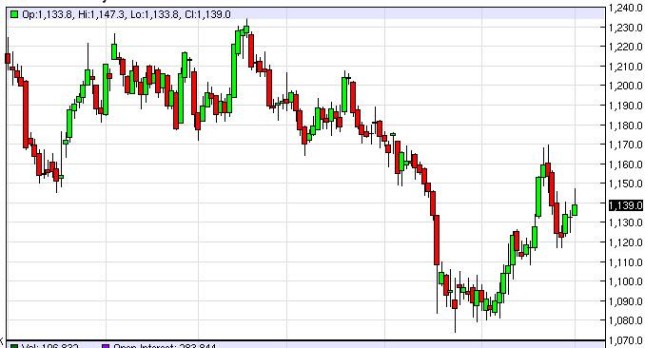
Source:Fxempire
[/text]
Categories :
Tags : Chart Gold

