
[text]
Technical analysis of Gold dated 13.02.2015
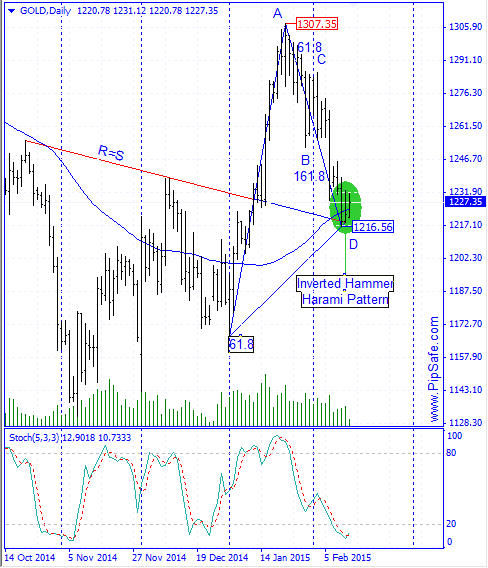
Gold was in a strong and consistent downtrend during the recent days that Sellers were successful in obtaining the lowest price of 1216.56.Price has been stopped from more descend with reaching to the specified support level (conversion level r=s) and In the range of formed bottom price there are Inverted hammer and Harami candlestick patterns that shows the possibility for formation of a successful bottom price in continuing ascending trend(need to be confirmed by a bullish candle)
As it is obvious in the picture below, between the top price of 1307.35 and bottom price of 1216.56 there is AB=CD harmonic pattern with ratios of 78.6 and 127.2 that warns the potential of ascending from the D point of this pattern.Stoch indicator is in saturation sell area and confirms the D point of this pattern by the next cycle and warns about the potential of ascending of the price during the next days.Generally until the bottom price of 1216.56 is preserved, there is a potential for ascending and price reformation in this Metal.
Written by the technical team of PipSafe Company
Gold Chart
[/text]
Categories :
Tags : AB=CD harmonic pattern Gold Gold & Oil News and Analysis Gold Analysis Gold NEWS Harami Pattern Inverted Hammer

