How to Use the RSI for Day Trading
At first, it should be said, no strategy works the same way for everyone. The strategy has to fit to your personality, risk control, day rhythm and so on. It should be said that it is almost always better to find your own strategy which fits you. I have 2 strategies i use myself.
Martingale strategy and Forex Trading (Forex Trading with Martingale Trading Method)
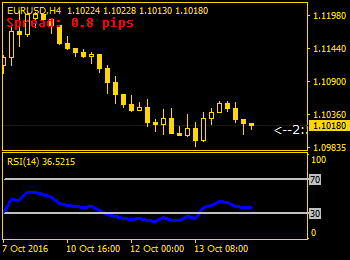
The first one is a martingale strategy. You should not use this strategy for all your savings, as it include bigger risk than other risk controlled strategies. The strategy works with the philosophy, that the markets always will retrace, after a big move upwards or downwards. I have my chart on a 4 hour time frame, where i first of all find support and resistance zones. Next i set up my RSI indicator. I like the RSI indicator to look 14 candles back, and evaluate them at the close of each bar. This is the basic settings in trading view.
How To Trade Forex with RSI Indicator (Find safe Trade With The RSI)
When i am looking for a potential trade, i look for price to be near a major resistance or support zone. The idea is to buy low, and sell high. The higher the price, the higher the chances for a downwards move and the other way around. Before i open a trade, RSI have to be above 70 for a short trade, and below 30 for a long trade. Example 1: Price is in a huge upward move.
How to Use RSI in Your Forex trades (How I Trade With RSI Indicator)
RSI is close to 70, and the price is close to a resistance zone. Now i wait for RSI to get above 70. When RSI pass 70, i set a short order at the resistance zone of 1 lot (This amount could be any thing, depending on your capital). If price already is at the resistance zone i open a short trade. There is now 2 possible outcomes. Either will price go against me, or in my favor.
If the price goes in my favor, i close my trade in profit at the first support zone price hits. If price goes against me, i make a short order of 2 lots (doubles the previously amount) at the next resistance zone and move my limit for the first position to break even.
Again there would be 2 outcomes. If price goes in my favor i close my 2 lot position in profit and the 1 lot position in break even. If price goes against me again, i open an order for the next resistance zone at 4 lots, and sets my limit for both the 1 and the 2 lot position at the opening price for the 2 lot position. I will keep doing this until price stops rallying, and retest the resistance zone where i opened the previously position.
My second Forex strategy is a trend and retracement strategy (Trading Multiple Time Frames with EMA In Forex)
For this strategy, i use exponential moving average. I have the 20, 50 and 100 periods of exponential moving average on my chart. I use 2 different time frames, both the 4 hour, and the 1 hour. I am looking for a good trend (When the 3 moving average is pointing in the same direction, and with space between them), on the 4 hour chart. Then there have to be a retracement to the 20 or the 50 periods EMA.
Reversal Candlestick Patterns (hanging man, hammer, engulfing pattern)
This zone should also be a resistance or support zone from earlier price action. Alternatively this zone could be a 0.618 fib retracement. Now i wait for price action to show a reversal sign. This could be a hanging man/hammer, engulfing pattern and so on. You can always google reversal patterns to find some good ones. Stop loss goes below the resistance/support zone, and take profit should be at least 2 to 1. Remember to trail your stop as price moves in your favor.
By Mathias Billeskov
Categories :
Tags : binary options strategy pdf binary options trading pdf binary options trading strategies binary options trading strategy pdf Find safe Trade With The RSI Forex Trading with Martingale Trading Method How I Trade With RSI Indicator How To Trade Forex with RSI Indicator How to Use RSI in Your Forex trades How to Use the RSI for Day Trading Martingale strategy and Forex Trading Reversal Candlestick Patterns RSI indicator to look 14 candles back support and resistance zones trading binary options strategies and tactics pdf free Trading Multiple Time Frames In Forex with EMA

