
Latest Forex Analysis – Economic data from the US yesterday was broadly positive helping to strengthen the US dollar, but the markets pulled back towards the end of the day. Ahead of tomorrow’s nonfarm payrolls report, markets could remain sideways. GBPUSD could potentially see some strong moves as the currency trades within a key resistance and support levels, with the downside likely to move for a test to 1.430 support.
EURUSD Daily Analysis
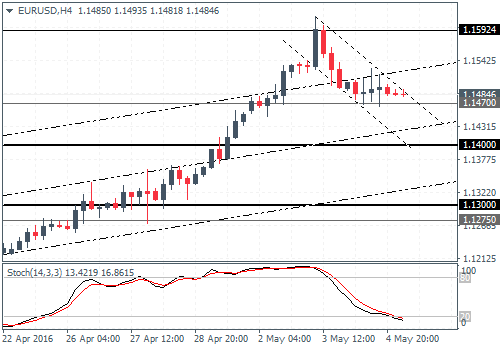
EURUSD (1.14): EURUSD closed in a small bodied candlestick pattern yesterday which could indicate a temporary pause to the decline while at the same time opening the risk for another move to the upside. Prices are seen to be well supported by 1.1470 support, and unless the support breaks, there is a potential for EURUSD to test the upside in the near term. On the 4-hour chart, EURUSD is forming a steep bullish flag pattern that could signal further upside. But the previous highs at 1.15925 must be cleared for further upside in prices.
USDJPY Daily Analysis
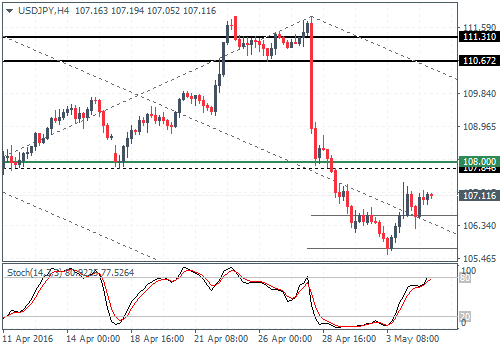
USDJPY (107.1): USDJPY continues to push higher on the daily chart with the Stochastics nearly signaling a bullish reversal. Resistance is seen near 108 – 107.85, which needs to be cleared on a daily session to signal further upside to the next main resistance at 110.672. On the 4-hour chart, we notice a hidden divergence, with the Stochastics printing a higher high against price’s lower high indicating a near-term downside. Support is seen near 106.60 which needs to hold failing which, USDJPY could resume its declines to test the previous lows.
GBPUSD Daily Analysis
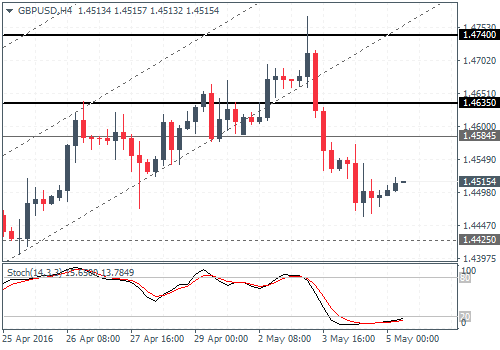
GBPUSD (1.45): GBPUSD continued to drift lower but so far has not tested the support at 1.44250. The 4-hour chart shows a possible retest to the upside near 1.4635 – 1.45845 to test the breakout level. Establishing resistance here could signal the downside to 1.4425 followed by 1.4312 – 1.430. The bearish bias is invalidated if GBPUSD closes above the identified resistance level, in which case, price action could continue pushing higher towards 1.4740.
Gold Daily Analysis
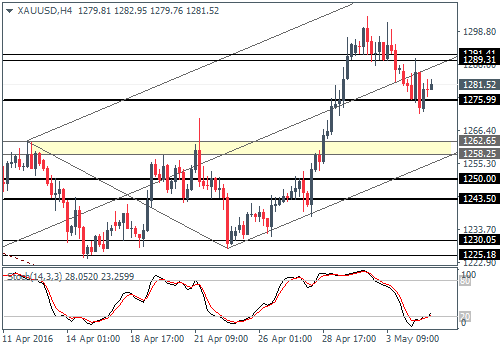
XAUUSD (1281.5): Gold prices posted a two-day low yesterday, but the declines were quickly rejected with prices closing back higher. Support at 1275.99 was clearly strong enough to push gold back above this level. Resistance at 1291 – 1289 remains likely to be tested, and a break above this resistance could open further upside in gold. A break below 1275 could, however, see gold prices dip to the next support at 1262 – 1258 levels.
Source: Orbex Forex Broker (Review and Forex Rebates Up to 85%)
Categories :
Tags : forex bonus without deposit Forex Broker forex broker bonus forex learn forex learning forex learning pdf Forex Market Analysis forex tutorials for beginners pdf how to trade forex for beginners pdf Latest Forex Analysis learning forex trading pdf Orbex Forex Broker

