
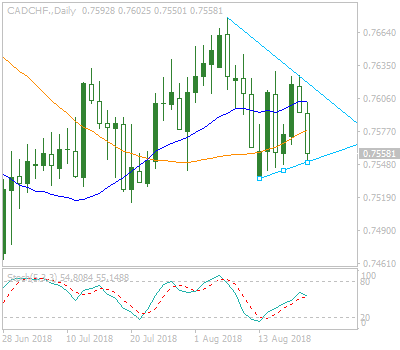
Analysis
The price crossed below both MAs the past two days, indicating that the trend will push downwards. Furthermore, a triangle was formed which might dictate where the pair trend will move next. A short position could be opened if the price breaks and closes below the formed triangle. Alternatively, but more unlikely, a long positon could be opened if the price makes a big move and breaks over the triangle.
Indicators Used
20 period MA on a daily chart
40 period MA on a daily chart
Stochastic Oscillator (5,3,3)
Resistance Levels
0.76300, 0.76775, 0.77093
Support Levels
0.75354, 0.75146, 0.73956
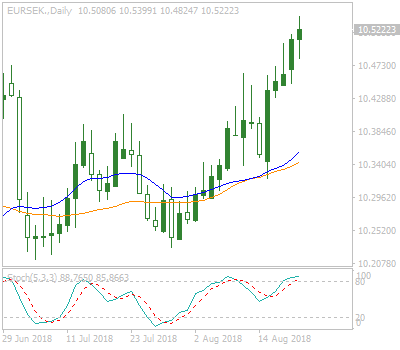
Analysis
The price made a steep bullish movement and broke over the 10.47410 resistance level. Since the stochastic oscillator moved in the overbought area and taking under consideration the aforementioned steep upwards movement, it is likely that a correction will follow. A short position could be opened if the next day’s candle does not make a new high.
Indicators Used
20 period MA on a daily chart
40 period MA on a daily chart
Stochastic Oscillator (5,3,3)
Resistance Levels
10.69688
Support Levels
10.32106, 10.22889, 10.21213
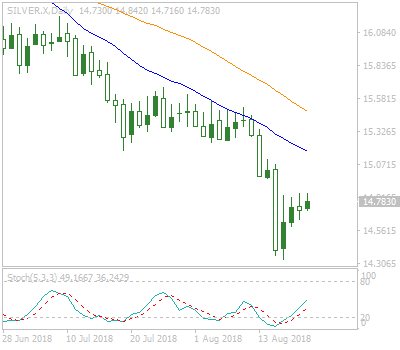
Analysis
The long bearish movement of the pair shows no signs of reversing. The price is trading deep below both MAs and since an upwards correction already happened; a short position could be opened in anticipation of the downtrend continuing.
Indicators Used
20 period MA on a daily chart
40 period MA on a daily chart
Stochastic Oscillator (5,3,3)
Resistance Levels
15.5070, 15.5510, 15.6070
Support Levels
14.3320
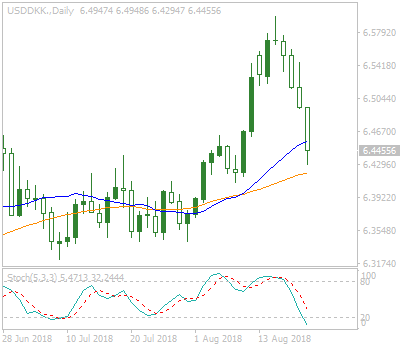
USD/DKK
Analysis
A correction followed the long bullish trend of the pair, with the last day’s candle closing below the 20 period MA. Assuming that the next day’s candle does not make a new low and taking under consideration that the stochastic oscillator moved in the oversold area, a long position could be opened in anticipation of the uptrend continuing.
Indicators Used
20 period MA on a daily chart
40 period MA on a daily chart
Stochastic Oscillator (5,3,3)
Resistance Levels
7.84986
Support Levels
6.40924, 6.34212, 6.32111
Source: XGLOBAL MARKETS Broker
Forex Cashback xglobal markets
Categories :
Tags :

