
NZD/USD Technical Analysis (2015.10.21)
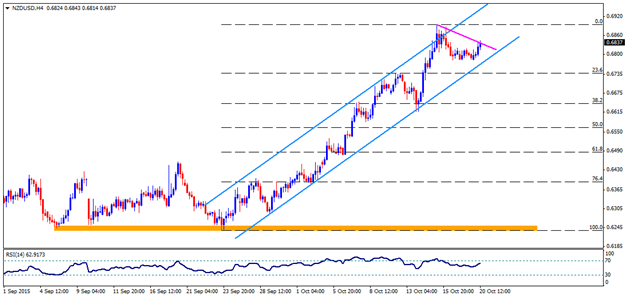
Ever since the NZDUSD managed to reverse from 0.6250 – 0.6235 horizontal support region, during late September, the pair kept following well orchestrated ascending trend-channel on.its H4 chart. Though, pair’s recent weakness to surpass the channel resistance, also marked by the short-term descending trend-line, presently near 0.6840, is likely limiting any further up-move, suggesting a pullback to 0.6780 horizontal support, quickly followed by the channel lower line, near 0.6760 mark. Should the pair fails to hold 0.6760, it can come down to 0.6735, including 23.6% Fibo of its September – October advance, breaking which 0.6640 and the 0.6580 are likely consecutive lower levels that it can witness during its extended downward trajectory.
Meanwhile, a break above 0.6840 can trigger its immediate advance to current month high, near 0.6900 round figure mark while a sustained move beyond 0.6900 is likely to be capped by the channel resistance, near 0.6950 at present. Moreover, a closing break above 0.6950 may fuel the pair towards important descending trend-line resistance, connecting July 2014 highs to April 2015 highs, near 0.7100 level.
NZD/USD Chart
Source: FxEmpire
Categories :
Tags : Forex News NZD/USD

