
Oil Analysis (2015.12.03)
Source:XM Broker (Review and Forex Rebates Up to 85%)
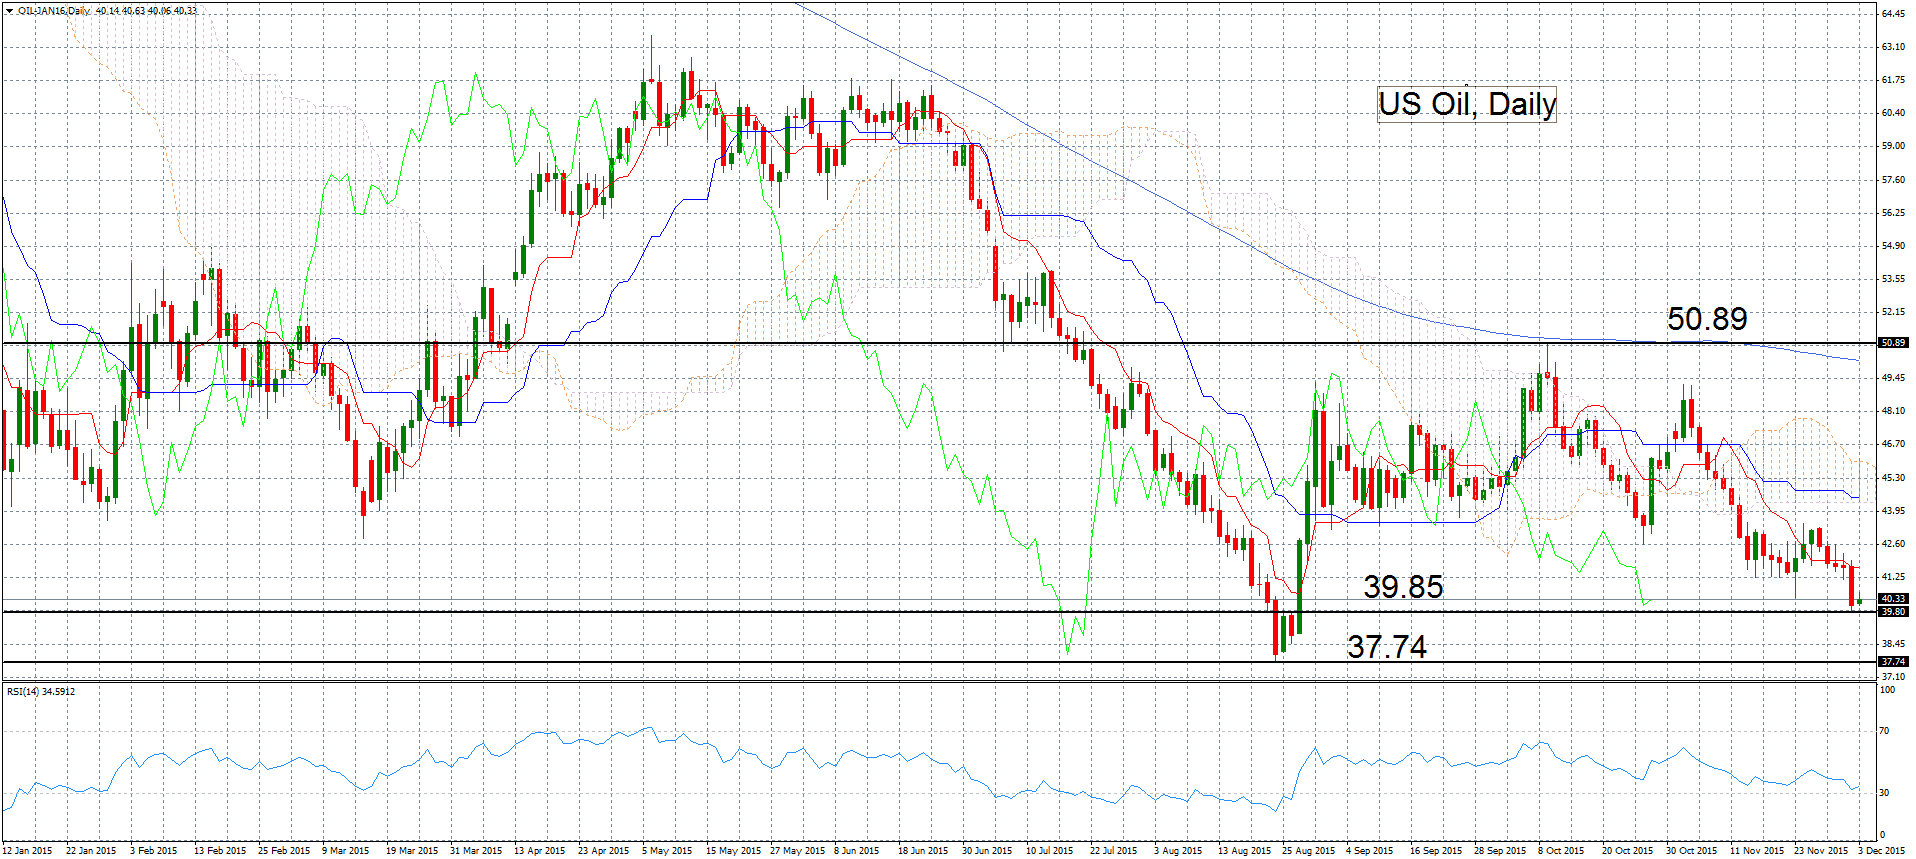
The price of US oil blend hit a fresh 3-month low the previous day as it briefly dipped below $40 a barrel. It has since recovered above 40, but the outlook remains bearish. Oil is looking to take out the 37.75 low it made in late August, which would mark oil’s lowest point since February 2009 (when stock markets around the world also made a low in the wake of the global financial crisis).
The indicators are all pointing to even lower oil prices as price action is below the Ichimoku cloud, the Tenkan-sen line is below the Kijun-sen line and the Relative Strength Index is bearish at 34 but not low enough to be characterized as oversold. The 200-day moving average at 50 is also likely to cap any attempt by oil to break higher.
Since the oil price didn’t manage to sustain a break above 50 in early October and actually failed to retest that level in early November, it has come tumbling down. Therefore 50 was the level where the last counter-trend rally was stopped and its significance is heightened by the fact that the 200-day average is also at 50 presently. Before 50, oil would have to climb to $46 in order to rise above the cloud. The cloud base is around $44 for now.
Oil Chart
Categories :
Tags : forex bonus without deposit Forex Broker forex broker bonus forex learn forex learning forex learning pdf forex tutorials for beginners pdf how to trade forex for beginners pdf learning forex trading pdf Oil Chart Oil Market Oil News

