
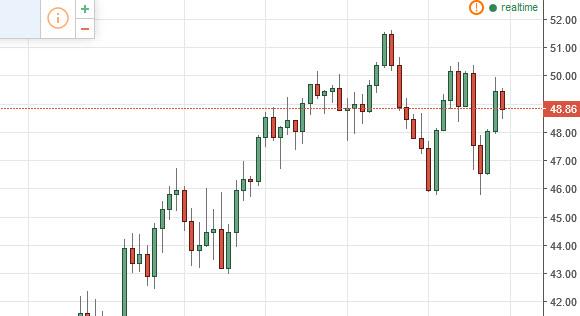
Oil Analysis – WTI Crude Oil The WTI Crude Oil market initially fell during the course of the session on Thursday, but as you can see turned right back around to form a bit of a hammer. The hammer of course is a positive sign, and as a result I believe that a break above the top of the hammer would be a buying opportunity as it would show a continuation of the bullish pressure. However, I would be much more interested in buying this market if we get above the $50 level, as it is a resistance barrier as well. With this, the market should reach towards the highs that we’ve seen recently, and perhaps even higher than that. On the other hand, it’s not until we get below the $46 level that I would be comfortable selling this market that has such a bullish overtone to it.
Brent
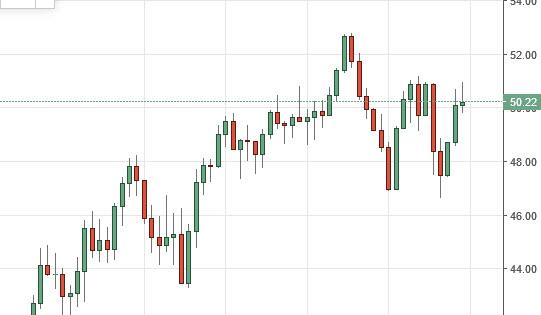
The Brent market initially tried to rally during the day but failed out the recent high near the $51 level. That being the case, the market looks as if we are pulling back from a very obvious barrier, and a break above the top of the range for the session on Thursday should send this market looking for the $53 level which was the most recent high. On the other hand, if we break down I think we will find plenty of support close to the $47 level, so even if we do end up finding ourselves in a shorting opportunity, it will be short-term at best. There is more than enough support all the way down to the $46 level to keep this market fairly bullish. If we did break down below there though, at that point in time I would assume that there is a trend change in the process, and would be more than willing to not only sell but to be very aggressive at that point time as I would expect the market to reach towards the $40 level after that. At this point though, I do believe that the buyers are still going to take control.
Source: FXEMPIRE
Crude Oil
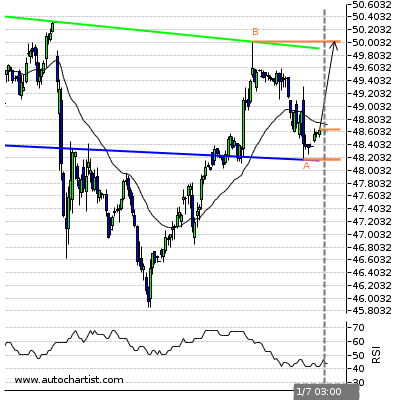
Summary :
Target Level : 50.01
Target Period : 3 days
Analysis :
Inverse Head and Shoulders identified at 01-Jul-03:00 2016 GMT. This pattern is still in the process of forming. Possible bullish price movement towards the resistance 50.01 within the next 3 days.
Resistance Levels :
( B ) 50.01Last resistance turning point of Inverse Head and Shoulders.
Support Levels
( A ) 48.175Last support turning point of Inverse Head and Shoulders.
Categories :
Tags : Crude Oil oil analysis WTI Crude Oil

