
Rising wedge on EURUSD (H4) signals a breakout to the downside – Failure to make a convincing close following the inside bar, EURUSD’s rising wedge pattern signals consolidation but opens the risk for a decline to 1.121 support that was broken during last Friday’s NFP report. Gold prices are now at the resistance level of 1262 – 1264 and could see a near term correction to the downside.
EURUSD Daily Analysis
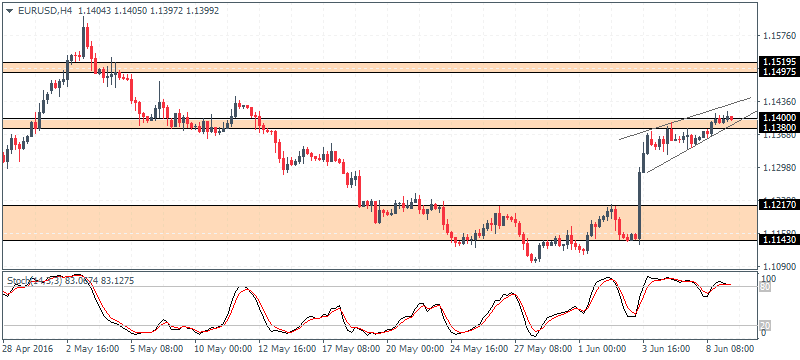
EURUSD (1.139): EURUSD attempted to breakout from the inside bar’s range from Monday’s price action, but the breakout is not quite convincing unless we see a strong follow through today. Failure to close above Monday’s range high of 1.1392 could signal a move back into the range keeping prices sideways in the near term. On the 4-hour chart, the price action is seen consolidating into a rising wedge pattern and a bearish divergence at the same time, which points to a possible downside breakout in prices. Closing below 1.138 could signal EURUSD to extend declines back to 1.12170 resistance which was broken and could now be tested for support.
USDJPY Daily Analysis
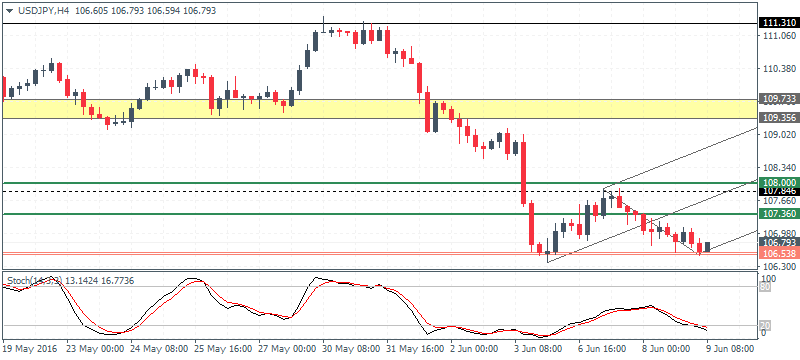
USDJPY (106.7): USDJPY has slowed in its momentum, but with prices trading below 108 resistance, the downside risks could see further declines down to previous lows near 106.23. However, price action is currently hovering near a developing support level at 106.50 region. A continued bullish rally from this support could see 107.36 being challenged and could give way to further upside, towards 108 resistance. However, USDJPY could continue to remain directionless unless price breaks above 108, for a move to 109.35 – 109.73 region. To the downside, a breakout below 106.53 could signal further downside with 106 and a possible test to 105 levels being very likely.
GBPUSD Daily Analysis
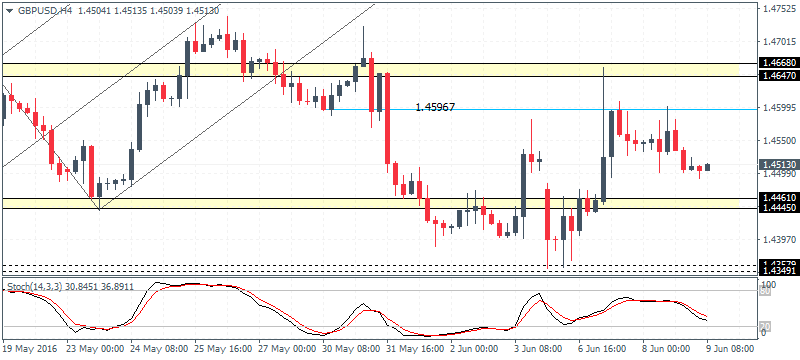
GBPUSD (1.451): GBPUSD has been stuck above 1.4425 support and 1.4635 resistance with prices trading within Tuesday’s range high and low. We expect this range bound price action to remain in place, and further gains or declines are likely to come by the fundamentals. On the 4-hour chart, the ranging price action is more clearly defined with the resistance seen at 1.4668 – 1.4647 and support at 1.4461 – 1.4445 levels.
Gold Daily Analysis
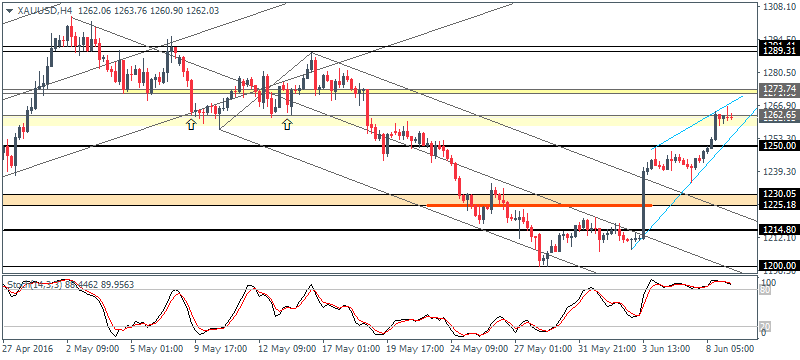
XAUUSD (1262): Gold prices surged above 1250 levels, but price action is clearly trading near the resistance level of 1264 and 1262. Failure to break above this region could see gold prices poised for a dip towards 1231 support. The 4-hour chart shows the steep rising wedge pattern with prices capped near the 1262.65 resistance. The most recent H4 session candlestick closed in a doji and considering that this occurred near the resistance level indicates a potential correction lower. 1230 – 1225 is the support zone of interest that could hold prices while above 1262.65, further upside could see gold test 1271 – 1272 resistance.
Source: Orbex Forex Broker (Review and Forex Rebates Up to 85%)
Categories :
Tags : doji forex bonus without deposit Forex Broker forex broker bonus forex learn forex learning forex learning pdf forex tutorials for beginners pdf fundamentals Gold Daily Analysis how to trade forex for beginners pdf learning forex trading pdf XAUUSD

