
S&P 500 Technical Analysis – The S&P 500 initially fell during the course of the day on Thursday, but found enough support below to turn things back around and form a hammer. If we can break above the 2100 level, we could continue to go much higher, and we do expect to see that happen given enough time. Ultimately, if we break above that level, and becomes more or less a “buy-and-hold” type of situation. There is so much support below the 2080 level that we aren’t even looking for selling opportunities at this point in time as the S&P 500 looks very healthy.
S&P 500 Chart
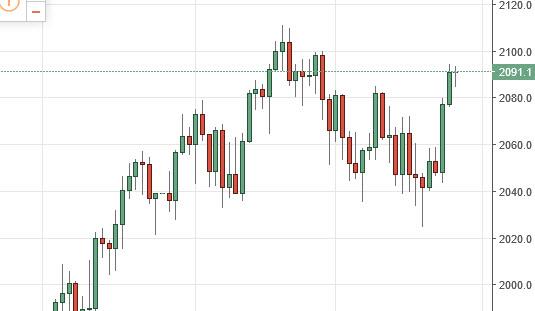
Source:Fxempire
The Standard & Poor’s 500, often abbreviated as the S&P 500, or just “the S&P”, is an American stock market index based on the market capitalizations of 500 large companies having common stock listed on the NYSE or NASDAQ. The S&P 500 index components and their weightings are determined by S&P Dow Jones Indices. It differs from other U.S. stock market indices, such as the Dow Jones Industrial Average or the Nasdaq Composite index, because of its diverse constituency and weighting methodology. It is one of the most commonly followed equity indices, and many consider it one of the best representations of the U.S. stock market, and a bellwether for the U.S. economy. The National Bureau of Economic Research has classified common stocks as a leading indicator of business cycles.
The S&P 500 was developed and continues to be maintained by S&P Dow Jones Indices, a joint venture majority-owned by McGraw Hill Financial. S&P Dow Jones Indices publishes many stock market indices such as the Dow Jones Industrial Average, S&P MidCap 400, the S&P SmallCap 600, and the S&P Composite 1500. It is a free-float capitalization-weighted index,[5] and has many ticker symbols, such as: ^GSPC, INX, and $SPX.
Categories :
Tags : S&P 500 S&P 500 Technical Analysis

