
Technical Analysis & AUD_Index(2016-02-24)
Source: IFC Markets Broker (Review and Forex Rebates Up to 85%)
The Australian dollar is strengthening on the commodities rebound. Moreover, market participants nw begin considering it as a safe haven asset amid the heightened risks of Brexit from EU. Let’s study the performance of the PCI – Australian dollar index as it embraces not only the US dollar but other major currencies including the European ones. Will the index continue edging up?
Great Britain is to hold a referendum on leaving the European Union on June 23, 2016. This news pushed the pound to Aussie exchange rate to the lowest in 10 months while the euro to Aussie rate to the lowest in 6-months. Apart from the European political risks, the Aussie edged up on the iron ore increase in price by 17% since early 2016. Together with the siderurgy, it accounts for about a third of the Australia’s exports while copper, which has been growing in price recently, accounts for another 25%. The base rate in Australia is at 2% and is one of the highest among the developed countries. This fact supports the AUD as well. The most important economic data will come out on March 1-3. Those are the balance of payments gap, the Q4 GDP and January trade balance.
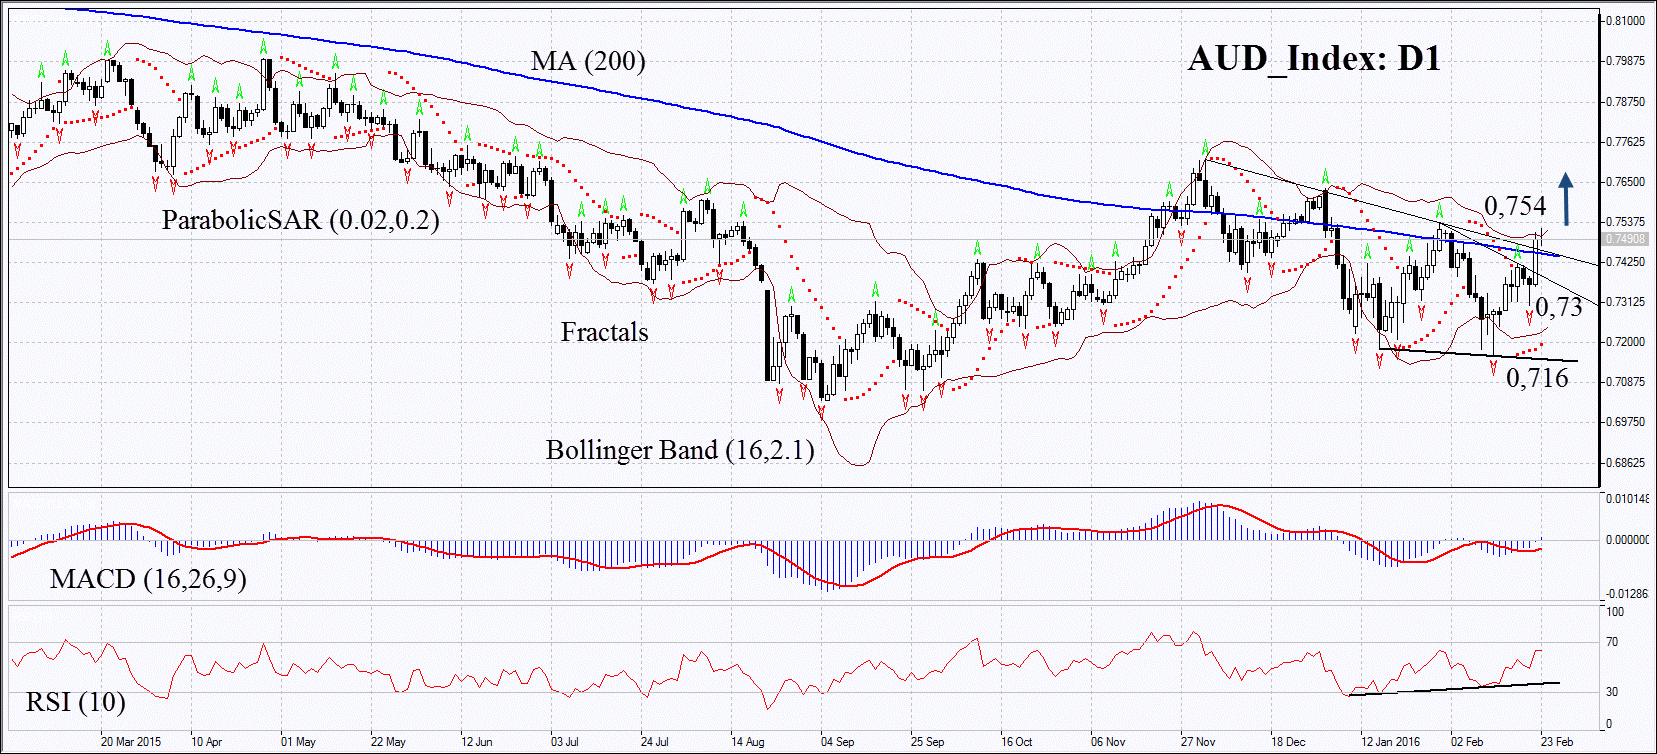
On the daily chart AUD_Index: D1 has left the downtrend to move upwards and surpassed the 200-day moving average. The Parabolic and MACD have formed the signals to buy. The RSI is moving upwards having surpassed the level of 50 but has not yet reached the overbought zone. It has formed the positive divergence. The Bollinger bands have contracted a lot which means lower volatility and are tilted upwards. The bullish momentum may develop in case the Aussie index surpasses the second fractal high and the Bollinger band at 0.754. This level may serve the point of entry. The initial risk-limit may be placed below the Parabolic signal and the last fractal low at 0.73. Having opened the pending order we shall move the stop to the next fractal low following the Parabolic and Bollinger signals. Thus, we are changing the probable profit/loss ratio to the breakeven point. The most risk-averse traders may switch to the 4-hour chart after the trade and place there a stop-loss moving it in the direction of the trade. If the price meets the stop-loss level at 0.73 or 0.716 without reaching the order at 0.754, we recommend cancelling the position: the market sustains internal changes which were not taken into account.
| Position | Buy |
| Buy stop | above 0.754 |
| Stop loss | below 0.73 or 0.716 |
Categories :
Tags : AUD AUD/USD binary options demo account forex bonus without deposit Forex Broker forex broker bonus forex learn forex learning forex learning pdf forex tutorials for beginners pdf how to trade forex for beginners pdf learning forex trading pdf

