
Technical Analysis AUDUSD (2016.02.12)
Source: IFC Markets Broker (Review and Forex Rebates Up to 85%)
The Australian dollar declined as the global stocks rout started following the selloff in China’s stock market since the new year. The Reserve Bank of Australia didn’t cut the interest at its policy meeting. Will the Australian dollar continue weakening?
The Reserve Bank of Australia (RBA) refrained from cutting the interest rate from 2.0% at its February 2 policy meeting. The central bank stated the economy is adjusting to falling demand for its commodity exports with China’s economy slowing down, and investment falling consequently, particularly in mining sector. GDP growth in 2015 was below average. At the same time it noted the expansion in non-mining sector of economy and signs of improvement in lending to businesses, employment and business conditions. Given declining oil prices, subdued growth in wages and restrained inflation in the world, policy makers expect inflation will likely remain low over the year. They deemed the monetary policy accomodative enough for continued growth and didn’t find it necessary to ease further via another rate cut, which supported the Australian dollar. However with exports accounting for 20% of GDP and China’s economy slowing down to a “new normal” of slower growth, lower commodity prices will continue weighing on Australian dollar. With commodity import demand from China expected to decline as its economy slows, growth in non-mining sectors of Australia’s economy will be the driver of its GDP growth in 2016, ultimately determining the strength of the currency.
AUD/USD Chart
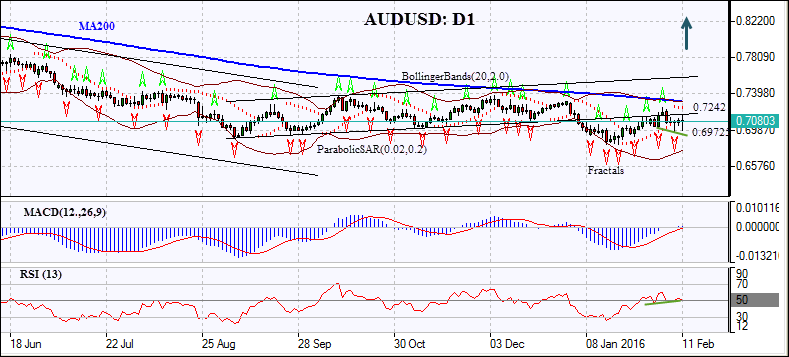
The AUD/USD had been trading within an uptrend channel on a daily timeframe in the last four months of 2015. As the sell-off in Chinese stock market triggered a rout in global stocks at the beginning of the new year the pair started falling. The price breached the lower channel and hit the lowest since April 2009 in-mid January. It had been rising since then and broke above the lower channel level but didn’t manage to sustain the upward momentum and retraced downward. Parabolic indicator gives a sell signal. The Bollinger bands have expanded which indicates increased volatility. The RSI oscillator is falling back toward the 50 level, but has formed a bullish divergence. The MACD indicator is above the signal line and the gap is rising, which is a bullish signal.
We believe the breaching of the lower channel and closing above the fractal high at 0.7242 will signify the resumption of bullish momentum. A pending order to buy can be placed above that level. The stop loss can be placed below the fractal low at 0.69725. After placing the order, the stop loss is to be moved every day to the next fractal low, following Parabolic signals. Thus, we are changing the probable profit/loss ratio to the breakeven point. The most risk-averse traders may switch to the 4-hour chart after the trade and place there a stop-loss moving it in the direction of the trade. If the price meets the stop loss level at 0.69725 without reaching the order, we recommend cancelling the position: the market sustains internal changes which were not taken into account.
| Position | Buy |
| Buy stop | above 0.7242 |
| Stop loss | below 0.69725 |
Categories :
Tags : AUD/USD AUD/USD News binary options demo account forex bonus without deposit Forex Broker forex broker bonus forex learn forex learning forex learning pdf forex tutorials for beginners pdf how to trade forex for beginners pdf learning forex trading pdf

