
Technical Analysis of Crude Oil – Crude traded above the $50 mark into the N.Y. open, peaking so far at $50.35, an eight-month high. Supply disruptions have been supportive of prices of late, as has Saudi Arabia’s pledge not to materially add to its current output levels. Cushing, OK stocks drew down over 1.0 million barrels last week, while the market expects U.S. stockpiles to fall nearly 4.0 million barrels for the latest week, when API reports inventories after the close, both adding to bullish sentiment. The next upside target comes at $50.92, which represents the October 9, 2015 top.Support on crude oil is seen near the 10-day moving average at 49.38. Momentum is relatively flat as the MACD (moving average convergence divergence) index prints in the red with a downward sloping trajectory which points to lower prices. The RSI on the other hand, moving average with price action reflecting accelerating positive momentum.
Oil Chart
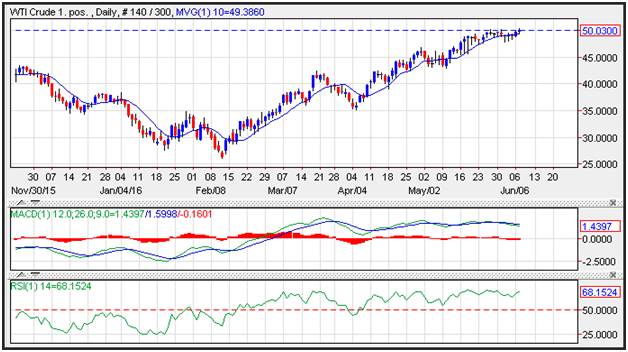
Source: Fxempire
Categories :
Tags : Gold & Oil News and Analysis MACD Oil Chart

