
[text]
Technical analysis of EUR/NZD dated 24.02.2015
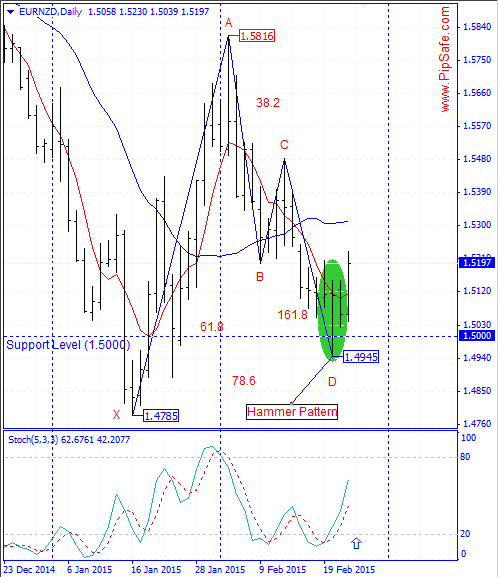
EUR/NZD was in a strong and consistent downtrend during the recent days that Sellers were successful in obtaining the lowest price of 1.4945.price with reaching to the important round level of 1.5000 has stopped from more descend ( Sellers used this level to exit their trades) and with formation of a bottom price in daily time frame has prepared a field for ascending of price.price in daily time frame created hammer candle stick pattern in bottom price of 1.4945 and has provided ascending of price and stop loss of price.
As it is obvious in the picture below, there is a harmonic Gartley pattern between the bottom price of 1.4945 and the top price of 1.5816 that there is a potential for changing price direction from D point of this pattern.Stoch indicator is in saturation sell area in daily time frame and it warns the potential for ascending of the price according to the next cycle.Generally according to the formed signs in price chart, until the bottom price of 1.4945 is preserved; price will have the potential for increasing and ascend.
Written by the technical team of PipSafe Company
EUR/NZD Chart
[/text]
Categories :
Tags : EUR/NZD Forex Analysis Gartley Harmonic Pattern Hammer Pattern Latest Forex News News

