
[text]
Technical analysis of NZD/USD dated 18.02.2015
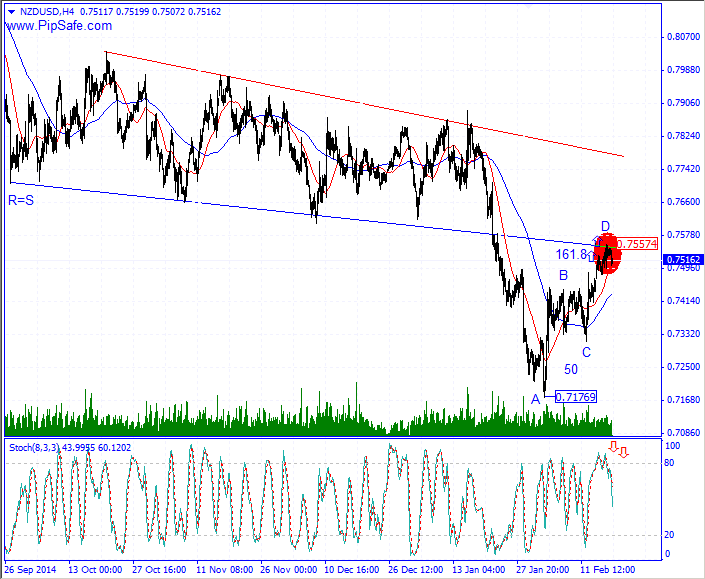
NZD/USD chart has experienced a strong ascending trend during the recent days that could record the top price of 0.75574.as it is obvious in the picture below , price has been stopped from more ascending with reaching to the Resistance level (S=R) and has formed a top price.
According to the formed movements in the price chart, between the bottom price of 0.71769 and the top price of 0.75574 there is an AB=CD harmonic pattern with the ratios of 50 and 161.8 which the D point of this pattern is completed and warns about descending of the price in this price range.Stoch indicator in 4H time frame is in the saturation buy area and is in divergence mode with the price chart that warns about changing price direction.Right now the first important warning for more ascending of price in this currency pair happens by breaking f the 0.75574 level(D point) in H4 time frame.
Written by the technical team of PipSafe Company
NZD/USD Chart
[/text]
Categories :
Tags : Analysis Forex Latest News News NZD NZD/USD

