
[text]
Technical analysis of USD/NOK dated 17.02.2015
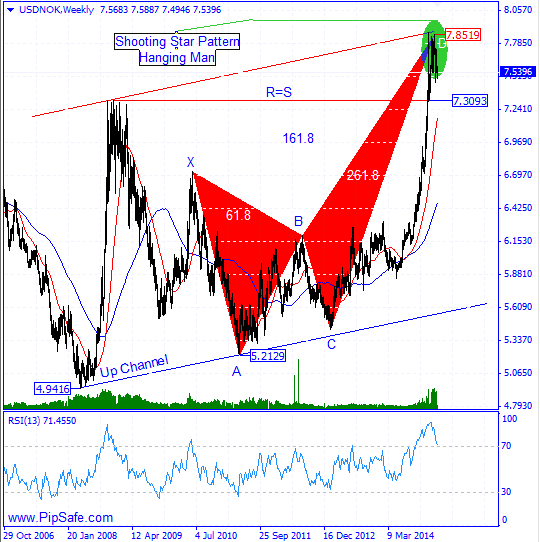
USD/NOK was in a strong and consistent uptrend during the recent months that buyers were successful in achieving the highest price of 7.8519.The price has stopped from more ascend by reaching to the resistance edge of Up Channel and a top price was created on the resistance line by the buyers retreat.There are a Shooting Star and Hanging Man candlestick patterns in top price of 7.8519 that warns the potential for formation of a successful top price and Vulnerability of ascending trend for buyers. With closing of the next bearish candle, this signal is fixed.
According to the formed price movements in the chart, there is a Crab harmonic pattern between the bottom price of 5.2129 and top price of 7.8519 that warns about descending of the price with completion of this pattern ending point.RSI indicator in weekly time frame is in saturation buy area and warns about descending of price according to the next cycle during the next weeks.Generally according to the formed signs in price chart, until the top price of 7.8519 is preserved, there is a potential for reformation and descending of the price in this currency pair.
Written by the technical team of PipSafe Company
USD/NOK Chart
[/text]
Categories :
Tags :

