
[text]
Technical Analysis of USD/SGD dated 2015.04.10
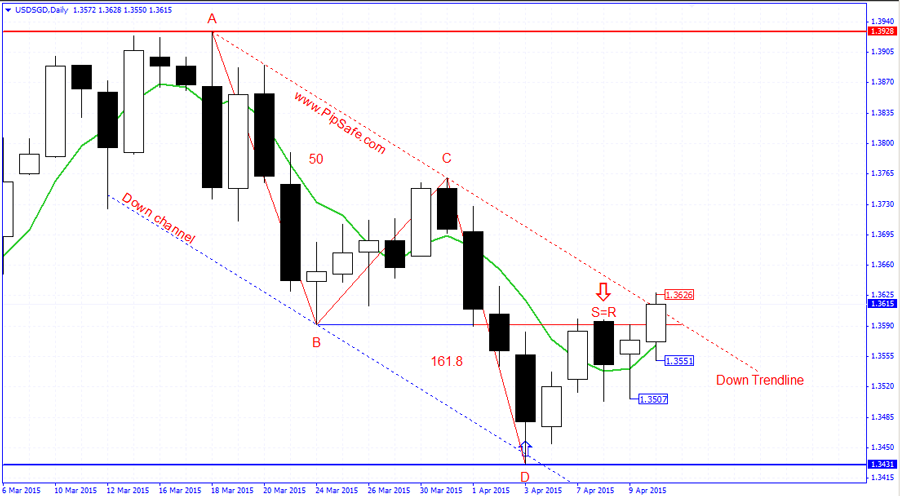
USD/SGD since the first days of this month with creating a bottom price(Piercing line pattern) of 1.3431 has started to ascend.Price during the downfall by reaching to the supportive edge of down channel has been stopped from more descending and right now the Sellers started to cash their trades.Price in daily time frame is above 5-day moving average and warns the potential of ascending of price during the next candles.
As it is obvious in the picture below, there is AB=CD harmonic pattern with ratios of 50 and 161.8 between top price of 1.3928 and the bottom price of 1.3431 that warns about changing price direction from the D point of this pattern.Currently there is not any clear reason for descending of price in daily time frame and the first warning for descending of price is formation of a top price and confirming of it in this time frame.
Written by the technical team of PipSafe Company
USD/SGD Chart
[/text]
Categories :
Tags : AB=CD harmonic pattern Forex Market Analysis Piercing line pattern

