Technical Analysis SP500(2016.03.17)
Source: IFC Markets Broker (Review and Forex Rebates Up to 85%)
The February core inflation (ex. food and energy) came out on Wednesday in the US being 0.3%, same as in January. Market participants expected the reading to fall to 0.2% but as we see that did not happen. Higher inflation raises the chances for Fed interest rate hike this year. Most investors believe this may happen twice. Higher rates increase the credit burden on US companies. May the S&P 500 stock index correct downwards?
US core inflation year on year is in line with Fed target of 2-2.5%. The February reading was at 2.3% while the headline inflation was 1%. Amid the lowest in a decade unemployment of 4.9%, this may encourage the Fed to hike the rates this year. The Fed meeting was on March 16 where the regulator left the rates unchanged and cut the projection for rate hikes this year from four to two. The leading economic indicator and weekly unemployment will be released on Thursday in US and the Michigan University consumer confidence index on Friday. We see their outlook as positive. Now the S&P 500 index is traded 1.3% below its level of the year opening. Such performance was due to the weak financial data in 2015. The gross earnings of the S&P 500 components rose by scarce 0.4% which is the most modest increase since 2009. Meanwhile, in the last six years, since 2009, S&P 500 advanced 80%. Many investors are worries the adjusted earnings on share of the index components is currently being 25% above their earnings by US GAAP. This is their maximum divergence since the recessionary 2008 year. As a result, according to the adjusted earnings, the average P/E ratio for the whole S&P 500 index is 17. If US GAAP indicators are taken, the P/E ratio equals 21 looking as overestimated.
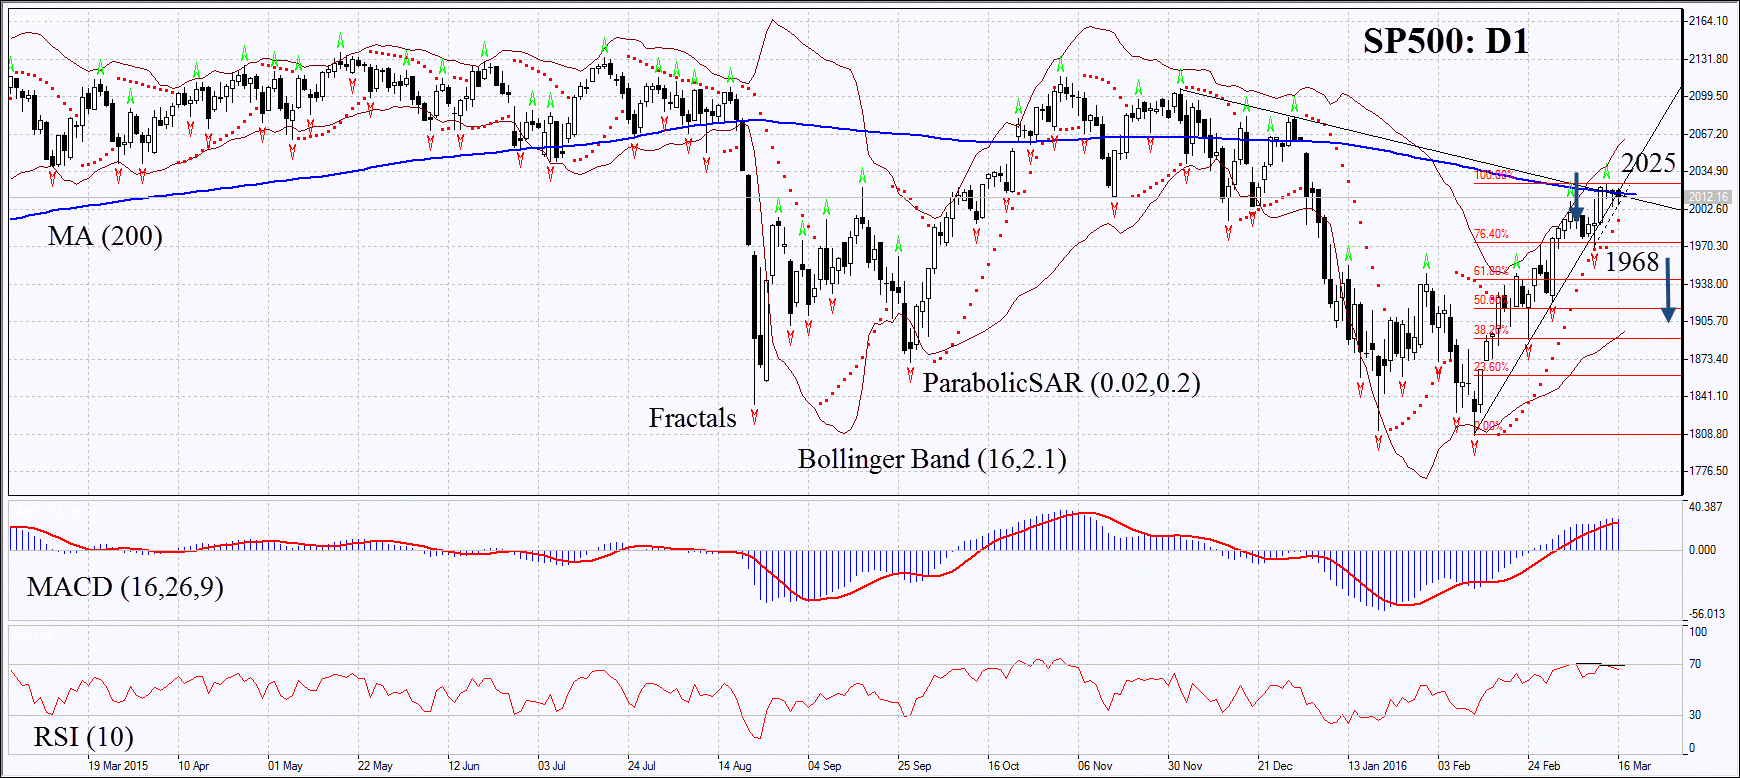
On the daily chart SP500: D1 hit a fresh 2-year low and is rebounding now. It has reached its 200-day moving average but failed to surpass it. The MACD and Parabolic indicators give bullish signals. The RSI is edging lower from 70 and has formed the negative divergence. The Bollinger bands have widened which means higher volatility. The bearish momentum may develop in case S&P 500 index falls below the last fractal low and the first Fibonacci retracement at 1968. This level may serve the point of entry. The initial risk-limit may be placed above the last fractal high at 2025. Having opened the pending order we shall move the stop to the next fractal high following the Parabolic and Bollinger signals. Thus, we are changing the probable profit/loss ratio to the breakeven point. The most risk-averse traders may switch to the 4-hour chart after the trade and place there a stop-loss moving it in the direction of the trade. If the price meets the stop-loss level at 2025 without reaching the order at 1968, we recommend cancelling the position: the market sustains internal changes which were not taken into account.
Position Sell
Sell stop below 1968
Stop loss above 2025
Categories :
Tags : binary options demo account Bollinger signals economic indicator forex bonus without deposit Forex Broker forex broker bonus forex learn forex learning forex learning pdf forex tutorials for beginners pdf how to trade forex for beginners pdf learning forex trading pdf S&P 500

