UK flash PMI’s in focus for GBPUSD – The ECB monetary policy meeting yesterday failed to push the markets around but a modest risk off sentiment is seen creeping back. Today’s important data highlights include the one-off Markit manufacturing and services PMI for the UK which could see the sentiment shift either way and potentially offer more clarity on what the BoE could do in August. Watch for a potential upside in gold which remains well supported after price managed to reclaim the 1327.50 support.
EURUSD Daily Analysis
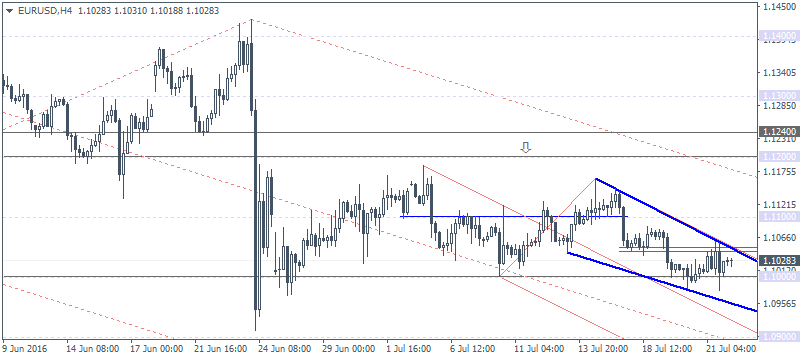
EURUSD (1.102): EURUSD was seen testing below support level of 1.10 yesterday after the ECB’s monetary policy meeting failed to push prices. EURUSD remains flat and closed yesterday’s session with an outside bar. The bullish divergence on the daily chart remains in play and puts the near term focus on EURUSD for 1.110. On the 4-hour chart, price action is seen consolidating into a falling wedge pattern and following the breakout above minor resistance at 1.105 – 1.104, further gains could be expected for a move to 1.110.
USDJPY Daily Analysis

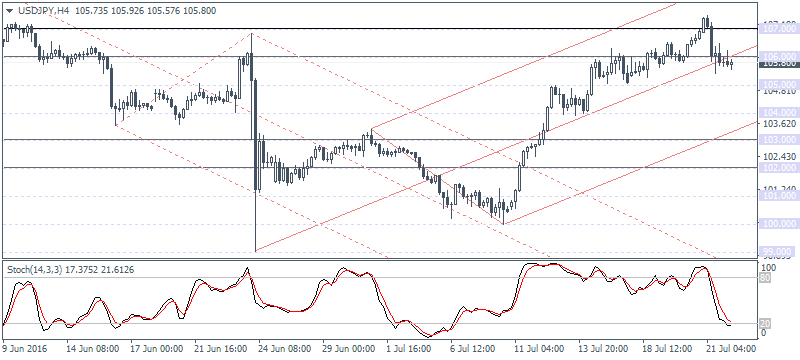
USDJPY (105.80): USDJPY fell strongly yesterday after reports emerged that BoJ Governor Kuroda shot down hopes of Helicopter money in an interview with the BBC. Price action closed in an outside bar and the bearish candlestick that formed right after Wednesday’s doji candlestick could signal near term declines. To the downside 104 remains the initial support level while the longer term support at 103 remains to be tested.
GBPUSD Daily Analysis
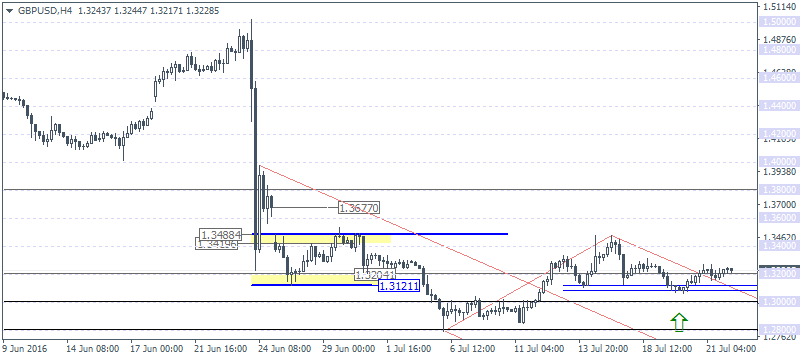
GBPUSD (1.322): GBPUSD continues to hover around 1.32. Today, Markit will be releasing the UK’s flash manufacturing and services PMI data to help provide clarity on the UK’s economic outlook and could have major implications on driving the GBP in either direction. The GBPUSD bias is bullish above 1.34 while a close below 1.32 could signal further weakness besides invalidating the inverse head and shoulders pattern. On the 4-hour chart we see a possibility for the head and shoulders pattern with the neckline support formed at 1.3085 – 1.312. A slide back to this level and a potential break down below this minor H&S pattern could contradict the inverse H&S from the daily chart. Further downside could be expected for a test to 1.289.
Gold Daily Analysis
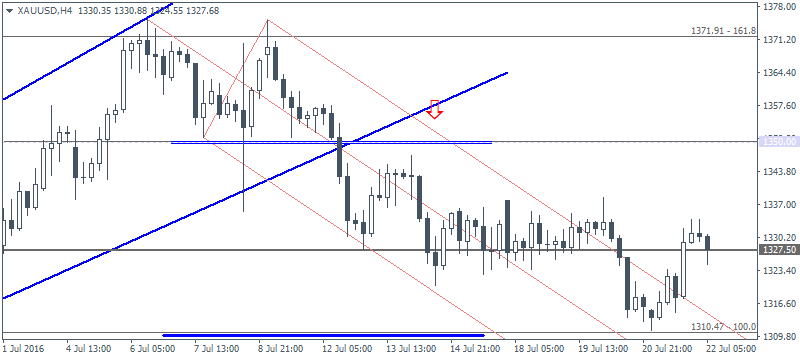
XAUUSD (1327.68): Gold prices were bullish yesterday, closing at 1331.09 and the daily chart shows price consolidating inside the bullish flag pattern. A breakout above 1350 is essential put the bullish view back in place. On the 4-hour chart, gold prices broke down below 1327.50 and fell close to 1310.50 before closing back above 1327.50. A lower high on the current pullback could signal a possible test towards 1350 to complete the bullish divergence. Therefore, the downside in gold remains limited unless price action breaks down below 1310.50, in which case 1300 remains the next major support level.
Categories :
Tags : doji candlestick EUR/USD GBP/USD PMI data UK flash USDJPY Daily Analysis XAUUSD

