
[text]
Technical Analysis of USD/CAD dated 2014.12.22
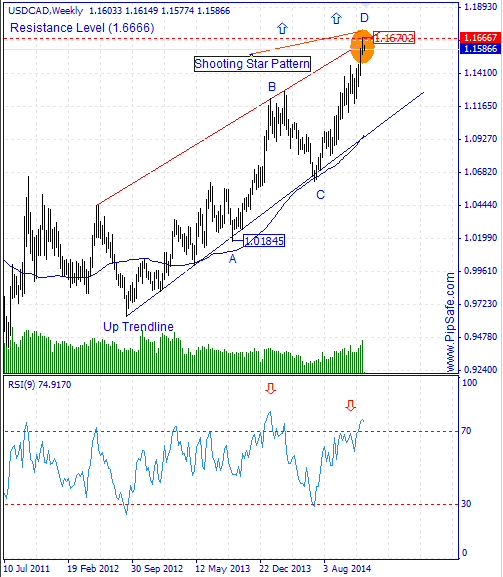
USD/CAD during the recent week was in a strong and consistent uptrend that buyers were successful in achieving the highest price of 1.16702. Right now price in long time frames such as monthly, weekly and daily is above 5-day moving average and warns about price increase in long period of time.According to the formed movements in the previous week, there is a Shooting Star candlestick pattern which shows indecision marker for ascending or descending and there is a warning for stopping of more ascending which need the confirmation by the next bearish candle.
According to the formed price movements in the chart, between the bottom price of 1.01845 and top price of 1.16702 , there is AB=CD harmonic pattern with ideal ratios of 61.8 and 161.8 that with completion of the D point there will be a warning for descending of price. RSI indicator in weekly time frame is in saturation Buy area and also in divergence mode with the price chart warns about changing price direction.Generally until the mentioned top price on the resistance channel edge is preserved , the price has the potential for reformation and descending in this currency pair.
Written by the technical team of PipSafe
USD/CAD Chart 2014.12.22
[/text]
Categories :
Tags : CAD Forex News Harmonic Patterns usd USD/CAD

