
[text]
Technical analysis of USD/CAD dated 2015.01.06
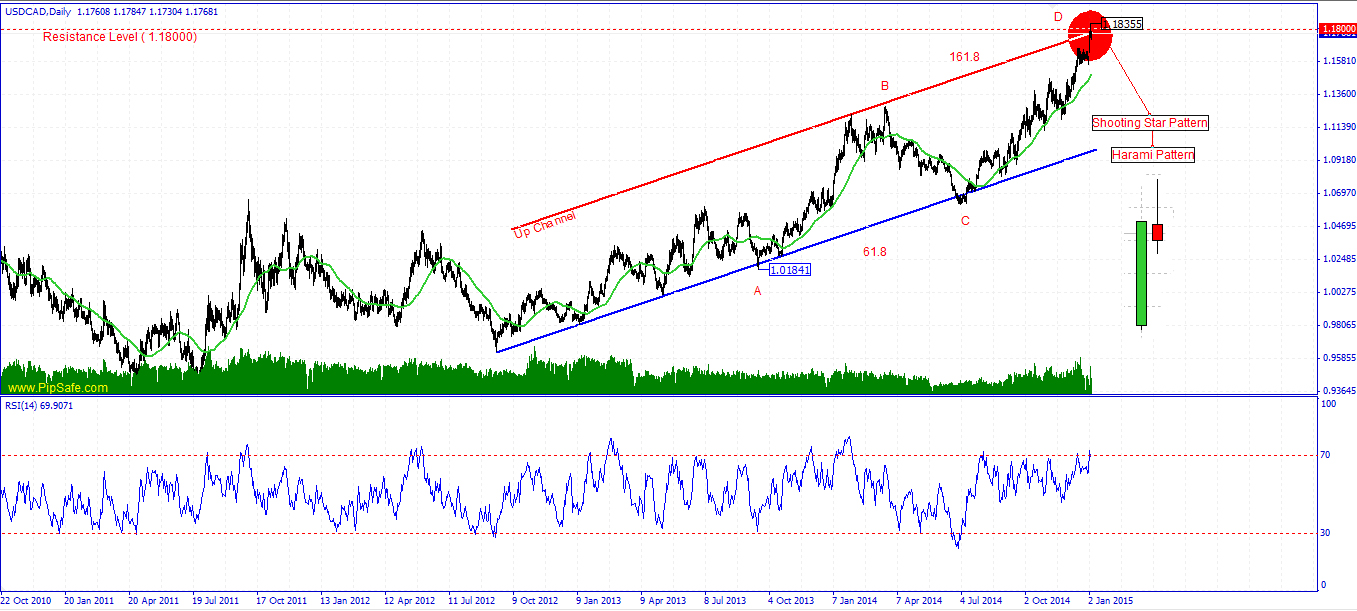
USD/CAD was in a strong and consistent uptrend during the recent weeks that buyers were successful in achieving the highest price of 1.18355.Price by reaching to the round resistance level of 1.18000 and the resistance edge of up channel has stopped from more ascend that shows buyers used this price level to exit their trades.There are Shooting Star candlestick pattern and also Harami Pattern in top price of 1.18355 that warns the potential for formation of a successful top price and Vulnerability of ascending trend for buyers.With close of the next bearish candle, this signal will be fix.
As it is obvious in the picture below, there is AB=CD harmonic pattern with ratios of 61.8 and 161.8 between the bottom price of 1.01841 and the top price of 1.18355 that warns changing price direction from D point.RSI indicator in Daily time frame is in saturation buy area and warns about descending of price according to the next cycle during the next days.(and confirms the harmonic D point)Generally until the Top price of 1.18355 is preserved, there is the possibility of decrease and descend of price in this currency pair.
Written by the technical team of PipSafe Company
USD/CAD Chart
[/text]
Categories :
Tags : AB=CD Harmonic Patterns USD/CAD USD/CAD Technical Analysis

