[text]
Technical analysis of USD/CHF dated 2015.01.08
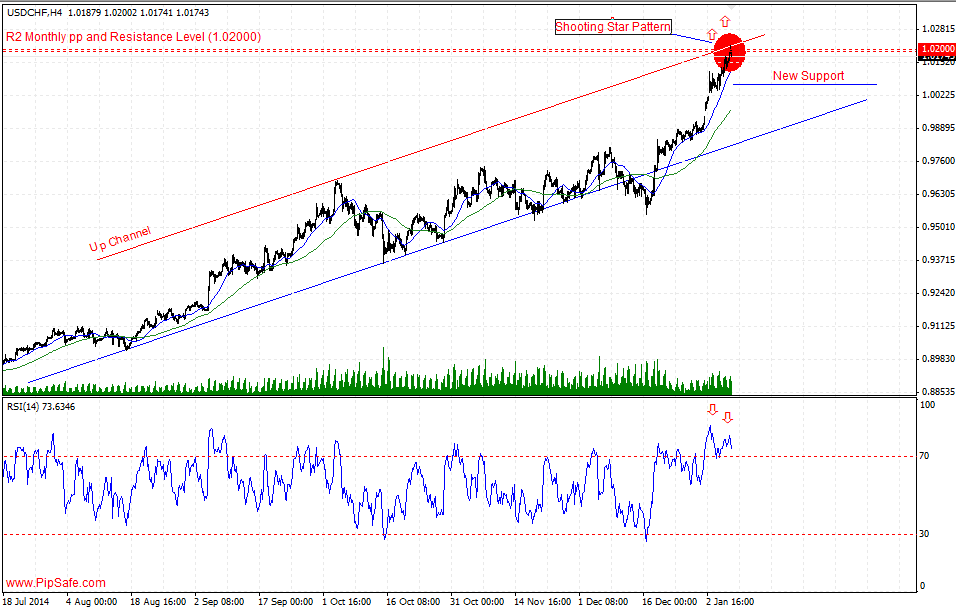
USD/CHF chart has experienced a strong ascending trend during the recent days that could record the top price of 1.02117.One of the buyers’ targets was the round level of 1.02000 that they were successful in reaching to it and the price was not able to ascend more by reaching to this level.Right now the price has reached to the resistance level of Monthly Pivot 2 and with forming Shooting Star candlestick pattern warns about formation of a top price (need to be confirmed by a bearish candle).
According to the recent strong ascending, price is in saturation buy area and there is the potential for descending and price reformation.RSI indicator is in saturation buy area and in divergence mode with the price chart in h4 time frame that confirms the current top price and warns changing price direction during the next candles.The first warning in this currency pair for ascending of price (in the same direction of long term time frames) is breaking of the resistance level of 1.02117.
Written by the technical team of PipSafe Company
USD/CHF Chart
[/text]
Categories :
Tags : USD/CHF Analysis USD/CHF News usdchf

