
[text]
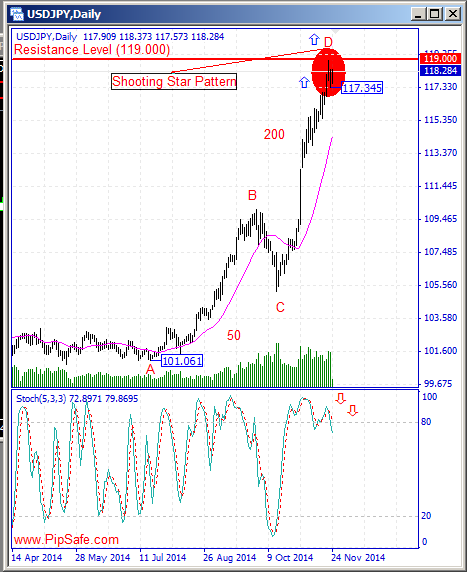
USD/JPY during the recent weeks had a strong ascending trend and could record the top price of 119.000. Right now the mentioned top price is one of the most important and nearest resistance level in front of the price that by breaking of it, the price finds the potential to reach the important resistance level of 119.340 or 120.900 .Price has been stopped from more ascend by reaching to the round resistance level of 119.000(the reason for some buyers to exit their trades) and by making a top price (Shooting Star) in daily time frame has started to reform.
According to the formed price movements in the chart, between the bottom price of 101.061 and top price of 119.000,there is AB=CD harmonic pattern with ideal ratios of 50 and 200 that with completion of the D point there will be a warning for descending of price.Stoch indicator in daily time frame is in saturation buy area and in divergence mode with the price chart that warns about the potential of descending during the next candles. One of the important warnings for decreasing of is breaking of supportive level of 117.345 (Low level of price changes in the previous daily candle).
Technical Analysis of USD/JPY Dates 2014.11.24
USD/JPY Technical Analysis
Written by the technical team of PipSafe Company
[/text]
Categories :
Tags : AB=CD harmonic pattern round resistance level Shooting Star Stoch indicator USD/JPY Analysis

