
Daily Forex Market Preview, 19/04/2016
Following lower oil prices yesterday, the markets opened on a weak note but soon recovered as USDJPY managed to pull back strongly after a brief stint near the 108 level. However, the unfolding triangle pattern on the 4-hour chart points to a possible dip back to 108. Economic data remains fairly light today leaving USD crosses likely to stay flat into Thursday’s ECB meeting.
EURUSD Daily Analysis
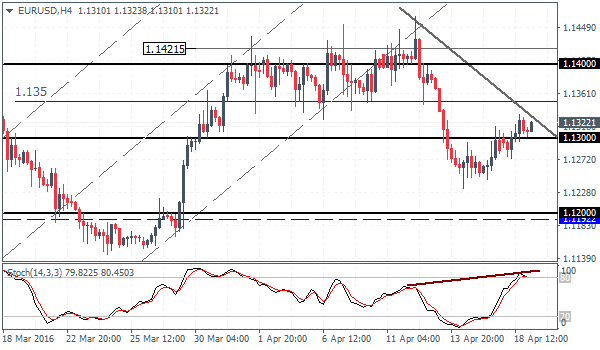
EURUSD (1.13): EURUSD continues to move very gradually with small ranges, now running for three consecutive days. Price action has managed to close above 1.13 level of support and could target 1.135 and move as high as 1.14 on bullish momentum. There is a hidden divergence taking shape currently, which could see the upside momentum fail in the near term. In this scenario, a break below 1.13 support could send EURUSD lower to 1.12 level of support.
USDJPY Daily Analysis
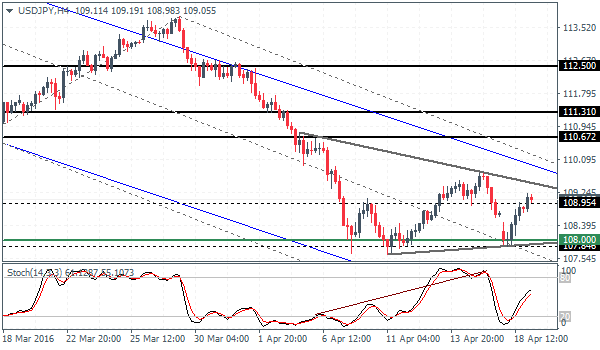
USDJPY (109.0): USDJPY is attempting to pull higher following yesterday’s strong bullish price action. A daily close above the most recent high at 109.40 could see further upside gaining momentum. Failure to post a new high could make way for a possible head and shoulders pattern on the 4-hour chart within the consolidating triangle establishing the neckline support at 108. A break below 108 could then pave the way for further downside in USDJPY. Alternately, a break to the upside off the triangle could see further upside towards 110.67 – 111.31.
GBPUSD Daily Analysis
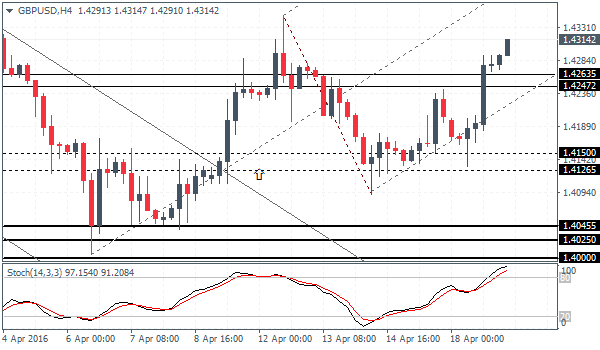
GBPUSD (1.41): GBPUSD has been trading bullish for the past two days, but prices are currently struggling near the long term upper median line on the daily chart. The upside bias is starting to gain conviction with prices clearing 1.426 – 1.424 strongly. This could see GBPUSD look towards testing the next main resistance at 1.443 – 1.4425. To the downside, the recently broken resistance level could be tested for support to validate the view. A break below this support could, however, turn the bias bearish with GBPUSD likely to move back to 1.415 – 1.4126.
Gold Daily Analysis
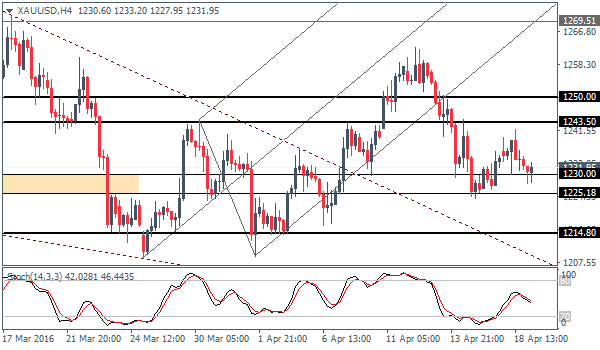
XAUUSD (1230): Gold prices are consolidating near 1231 level and also forming a potential head and shoulders pattern against a slanting neckline. A break below 1220 – 1210 support could speed up the declines further as viewed from the daily chart. For the moment, Gold could stay range bound within 1243 – 1250 and 1230 – 1225 levels ahead of further declines lower, which could see a test to 1215 initially followed by 1280.
Source: Orbex Forex Broker (Review and Forex Rebates Up to 85%)
Categories :
Tags : forex bonus without deposit Forex Broker forex broker bonus forex learn forex learning forex learning pdf forex tutorials for beginners pdf how to trade forex for beginners pdf learning forex trading pdf

