
[text]
USD/JPY Technical Analysis (2015.06.01)
Source: Mayzus Forex Broker
Last week, USD/JPY grew by over 250 points owing to the Dollar’s general appreciation against a basket of major currencies. The session closed above 124.00, for the first time since 2002. Several important macroeconomic releases that may seriously influence the pair’s price evolution are expected this week. Particular attention should be paid to the data on change in Japanese money supply: this index is one of the key inflation indicators. According to preliminary forecasts, money supply will decrease by 0.9% as compared to April’s data (35.2%). That’s a negative factor for the Japanese currency.
Let’s have a look at technical indicators. On the daily chart, 20-, 50- and 100-period moving averages are below the price line and directed upwards, which confirms the current upward trend. The MACD histogram is located in the positive zone and its volumes are increasing by leaps and bounds, which also confirms the bullish trend. A level of 121.94 (20-period moving average) is the nearest support level. The following supports are located at 120.89 and 119.72 – M50 and M100, respectively. The 3-year minimum at 118.86 is a powerful support level. A level of 125.00, psychologically important level, serves as resistance.
USD/JPY Chart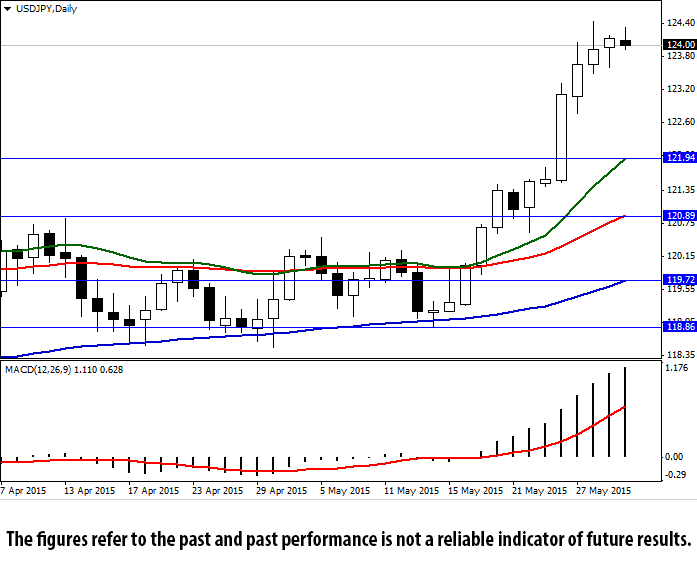
[/text]
Categories :
Tags : forex bonus without deposit Forex Broker forex broker bonus forex learn forex learning forex learning pdf forex tutorials for beginners pdf how to trade forex for beginners pdf JPY learning forex trading pdf News usd USD/JPY

