Watch the bullish pennant pattern in Gold – Gold prices might be looking weaker on the daily and weekly time frame, but the 4-hour chart shows a bullish pennant pattern which could signal further upside in gold. With the UK referendum vote due in less than a day, gold prices could remain in a range with the likelihood of a move in either direction. $1250 remains the key support which needs to be broken to establish the downside bias in gold, while above $1300, gold prices could see further gains in store.
EURUSD Daily Analysis
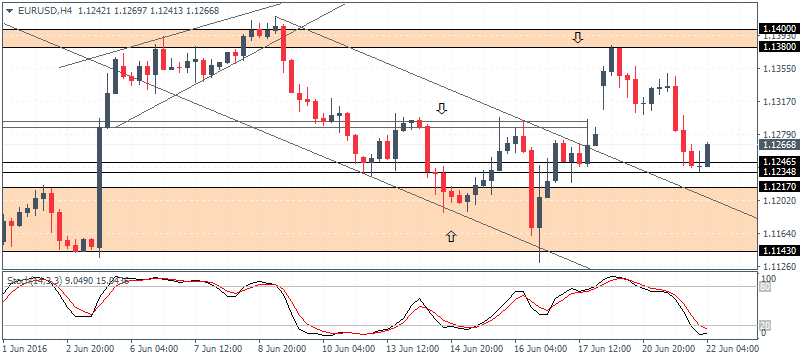
EURUSD (1.126): EURUSD has closed two consecutive days on a bearish note with the price action in the form of a shooting star. The 1.130 level is clearly acting as resistance and could see prices capped to the downside. On the 4-hour chart, as expected, EURUSD fell back to the lower support near 1.1246 – 1.1234 support with the most recent price action forming a doji followed by a bullish close later on. This could indicate a near-term ranging price action between 1.138 and 1.125 levels.
USDJPY Daily Analysis

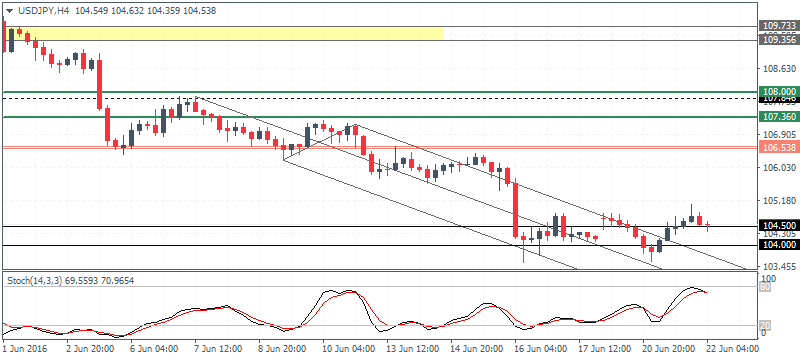
USDJPY (104.5): USDJPY managed to close on a bullish note yesterday and also formed an outside bar on the daily chart. With the range of 105.06 and 103.58 being established, further price action is likely to be determined on a breakout above or below this range. Support near 104.5 and 104.0 will be likely to hold out for the near term while 106.538 remains a key resistance level of interest in USDJPY, which could be targeted on a close above 105.06 levels. Below 103.58, USDJPY risks moving lower towards the 103 round number support.
GBPUSD Daily Analysis
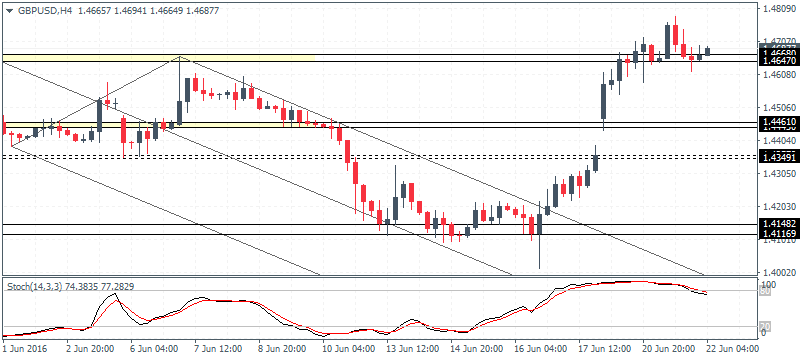
GBPUSD (1.468): GBPUSD remains range bound within 1.4743, and 1.4635 on the daily chart and the volatility is only likely to pick up from here on. On the 4-hour chart, GBPUSD remains well supported above the minor resistance at 1.466 – 1.464 which is now acting as support and could keep prices poised for further upside towards 1.485. To the downside, a break below 1.464 could trigger sharp declines down to 1.446 and 1.4445 with the risk of a leg lower towards 1.435 where the Monday’s up gap remains unfilled.
Gold Daily Analysis
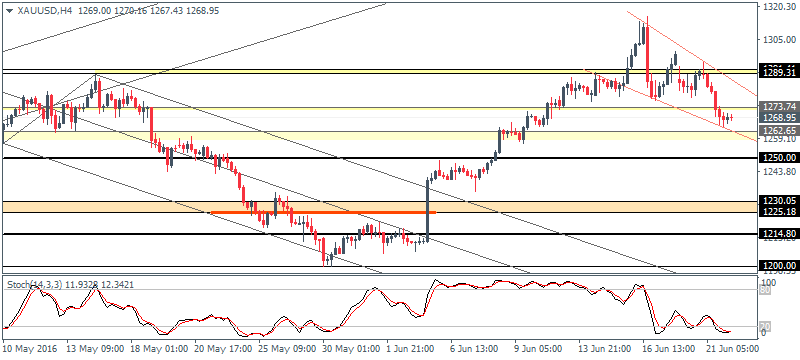
XAUUSD (1268.95): Gold prices posted sharp declines yesterday with the 1291 resistance keeping a lid on the rallies. To the downside, the next main support is seen near the 1250 round number support. With gold prices clearing below the 1273 minor support level further declines are likely. Alternately, to the upside, resistance near 1290 could be tested in the near term and above $1300 the gains are limited unless gold prices establish support here. There is also a scope for a possible bullish rally with the 4-hour chart showing a bullish pennant pattern which, if validated could see further upside in gold if prices clear above the 1307 resistance high formed last week.
Source: Orbex Forex Broker (Review and Forex Rebates Up to 85%)
Categories :
Tags : bullish pennant EURUSD Daily Analysis forex bonus without deposit Forex Broker forex broker bonus forex learn forex learning forex learning pdf forex tutorials for beginners pdf Gold Daily Analysis how to trade forex for beginners pdf learning forex trading pdf XAUUSD

